As a musician, Patrick Atwater of Full-time Data Analytics Cohort 4 decided to create a capstone project to help his independent music friends tap into the power of playlists on Spotify!
Read More
Topics:
Analytics + Data Science
Megan Amaral of Part-time Data Analytics Cohort 4 is now working as an Analytics Engineer! Listen to her podcast in our latest graduate spotlight to learn about her NSS experience!
Read More
Topics:
Student Stories,
Analytics + Data Science
When the music industry began to shut down in 2020 due to the pandemic, Eric Broestl of Full-time Data Analytics Cohort 4 began looking at the data behind the growing spread of COVID-19 and was fascinated by the data. After some research Eric came to know NSS.
Read More
Topics:
Student Stories,
Hiring?,
Analytics + Data Science
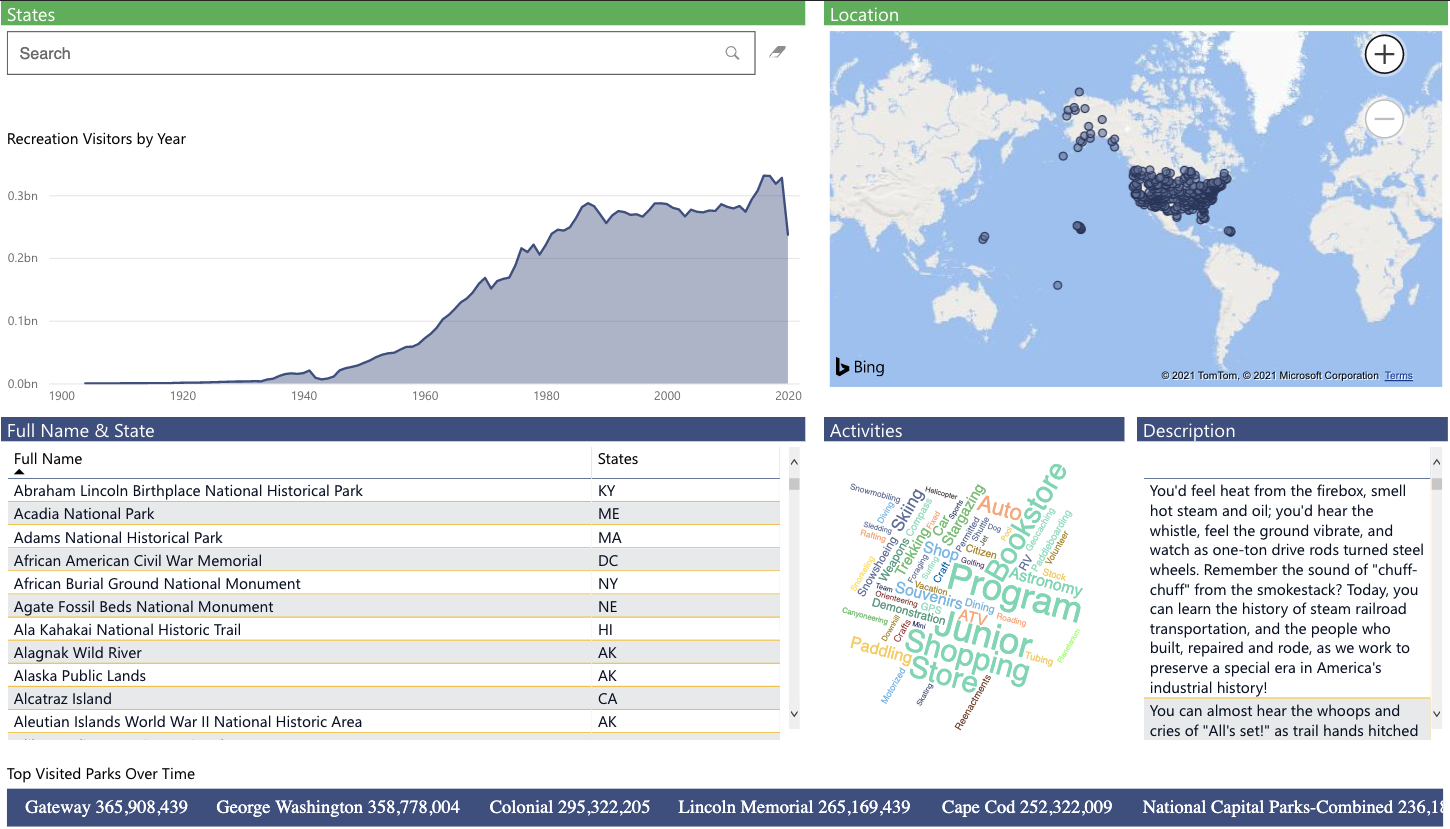
In June our seekers and students from the Analytics + Data Science programs analyzed data from the national parks for our the June Data Viz challenge!
Read More
Topics:
Student Stories,
Learning,
Analytics + Data Science
Since graduating from Data Science Cohort 4, Maeva has accepted his first job as a data analyst! Listen to Maeva's podcast to hear about his NSS experience and capstone projects.
Read More
Topics:
Student Stories,
Analytics + Data Science
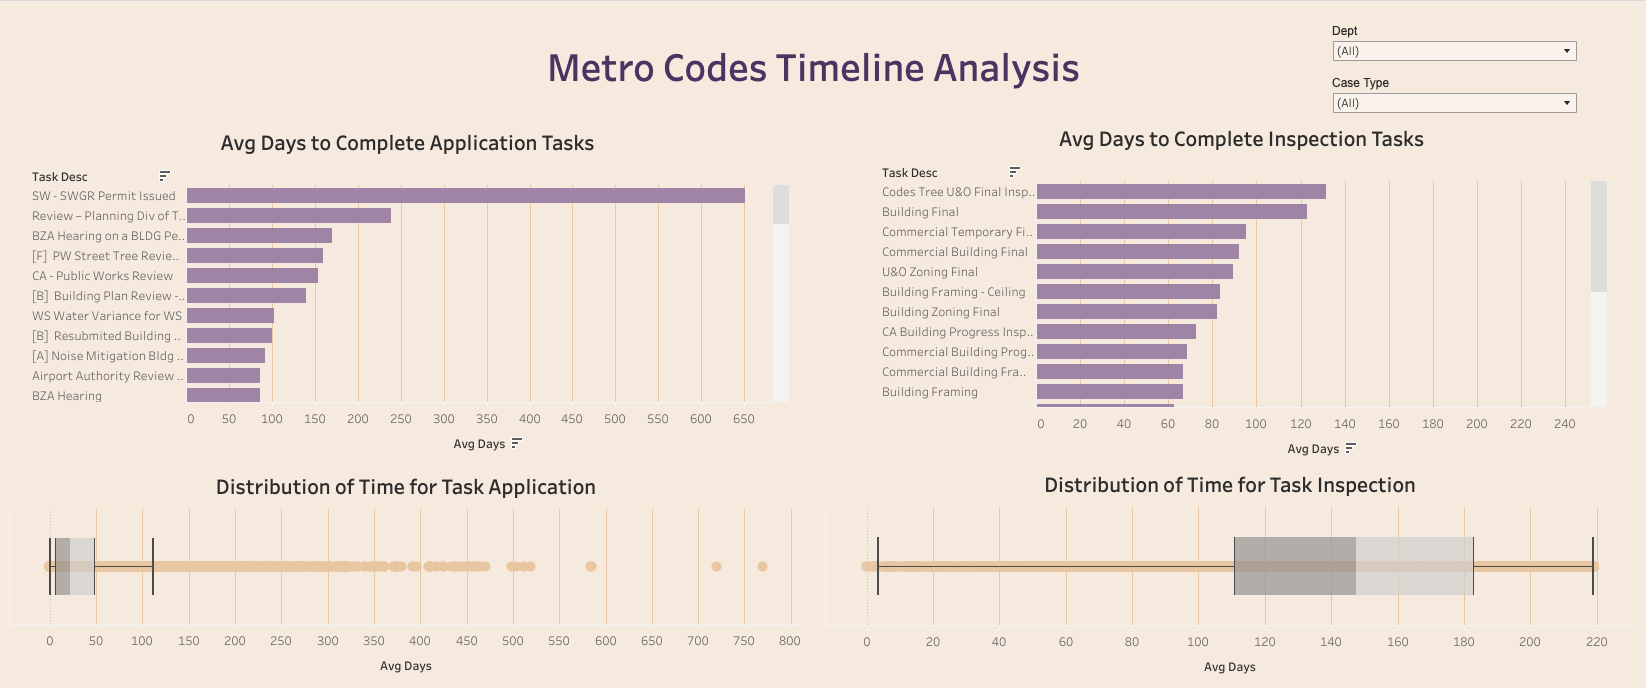
Last month the Metro Nashville Codes Department presented a data challenge to the students of Full-time Data Analytics Cohort 4 and asked the students to share their insights into the permit process to help the department better plan their work.
Read More
Topics:
Student Stories,
Learning,
Analytics + Data Science
Before he was a member of the Part-time Data Analytics Cohort 4 at NSS, Engida Amare worked as a Salesforce data specialist in a non-profit organization in Tennessee.
Read More
Topics:
Student Stories,
Hiring?,
Analytics + Data Science
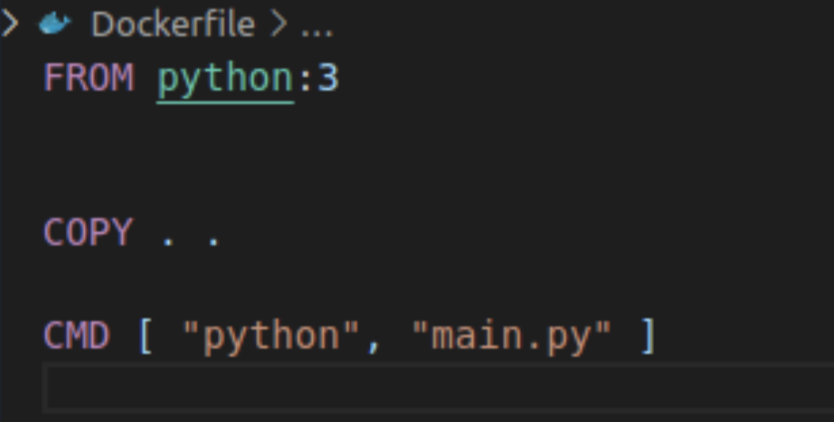
Recently, Will Johns met with our Seekers to give them an introduction to Docker and share why he thinks graduates should spend some time learning it.
Read More
Topics:
Learning,
Analytics + Data Science
Since attending NSS’s Data Analytics Bootcamp, Scott Boyer of Part-time Data Analytics 4 shares that he’s been able to greatly enhance and expand his capabilities to tackle even larger data problems!
Read More
Topics:
Student Stories,
Hiring?,
Analytics + Data Science
Like all growing organizations, we’ve had to adapt some of the things that previously worked, but are not scalable in a rapidly growing organization. One of those improvements is the introduction of advisory boards to extend how we collaborate with Middle Tennessee employers.
Read More
Topics:
News,
Community,
Analytics + Data Science,
Get Involved,
Web Development


