“Human migration is a common, yet often controversial phenomenon,” says Oluchi Randolph of Data Science Cohort 4. “Even when a newcomers' legal status is not a point of contention, their presence can challenge a range of views on identity, place, and belonging. America has been described as a cultural "melting pot", but what exactly does this mean? And how do we meaningfully examine how individuals and communities experience, promote, and challenge this "melting" as it happens?”
Building on her dissertation work at Vanderbilt University, Oluchi chose to explore perspectives on the immigrant integration process in the United States for her mid-course capstone project.
The Data Question
Focusing on refugee arrivals, Oluchi explored two questions:
- What are the origins of people who are admitted to the U.S. as refugees?
- How do characteristics of resettlement communities differ in ways that could influence adjustment to life in the U.S. for refugees?
“Countless books, documentaries, and dissertations have not exhausted all that there is to explore on this topic,” she shares. “Therefore, it is unlikely that a single Shiny app can do it justice either. What this app can do, however, is function as a resource for others who care about these types of questions.”
Cleaning The Data
Using data from four different sources meant Oluchi had to approach each dataset a bit differently. Using the R package tidycensus, she was able to access American Community Survey (ACS) data from the Census Bureau. Data from the Migration Policy Institute on the Refugee Admission Ceiling and Arrival Data was stored across multiple Excel sheets. She used readxl to import the data and the tidyverse collection of libraries to subset and extract the data she needed. The FBI crime data was separated into individual .csv files by each type of crime by state. Oluchi explains, “Since I was interested in incidences of five types of crimes in six states, I learned how to write my own function to pull in and merge all thirty csv files into a single [data frame] in one command.”
“One of the challenges I dealt with had to do with cleaning ACS 5-year data for comparing statistics in 2009 and 2019. Some variable names no longer existed, and in many cases the variable labels were slightly (or completely) different. To solve these and the other types of issues I encountered, I had to be creative and even more meticulous than normal when writing my code.”
Visualizing The Data
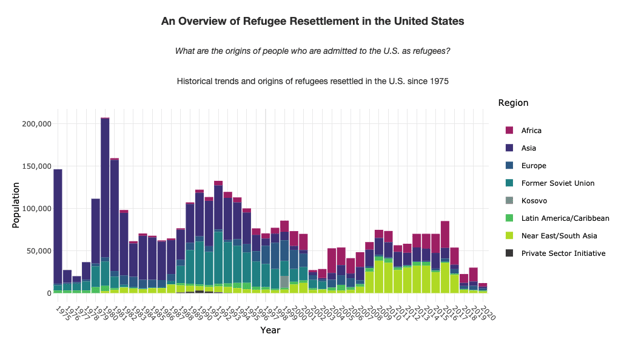
The core of Oluchi’s Shiny app is under the Explore tab. Before diving into the data, she opens with The Process tab that gives an introduction to the refugee resettlement process. With data covering the past 45 years, the tab called An Overview answers the question, what are the origins of the people who are admitted to the U.S. as refugees? Users can view the data in four ways, annual admissions by region, admissions ceilings vs. actual admissions, top 15 countries of origin for 2009, and top 15 countries of origin for 2019.
“The bar chart illustrating Annual Refugee Admissions to the U.S. by Region (pictured below) provides a snapshot of how international events (like the war in Kosovo), national incidents (like the 9/11 attacks), and presidential administrations influence the number and composition of refugee arrivals admitted to the U.S.,” she explains.
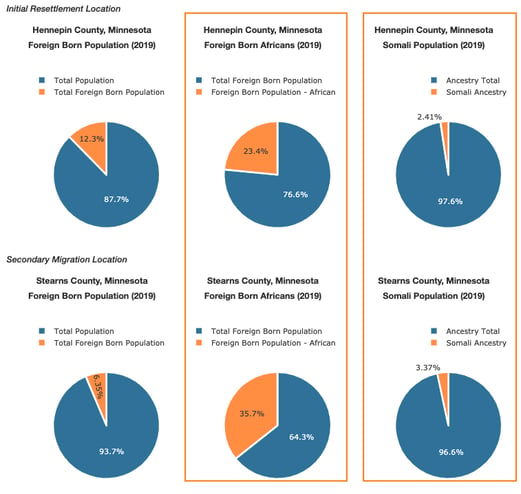
The case study tab showcases several comparative visualizations. “I hope [these visualizations] assist me with raising questions about whether and how varying characteristics of a location could differently impact resettlement experiences for refugees in general, and Black, Muslim Somali refugees in particular,” Oluchi shares.
The data found in her Case Study raised several questions for further exploration. One area Oluchi highlights is the comparison between Minneapolis, MN (Hennepin County) and St. Cloud, MN (Stearns County). Both are home to a large Somali population, but have different community characteristics, despite only being 65 miles apart. “Currently, Minneapolis, MN (Hennepin County) is home to the largest Somali population in the U.S.,” she states. “However, this data shows that between 2009 and 2019, the proportion of foreign-born Africans and people who identify as Somali in St. Cloud, MN (Stearns County) surpassed those of Minneapolis.”
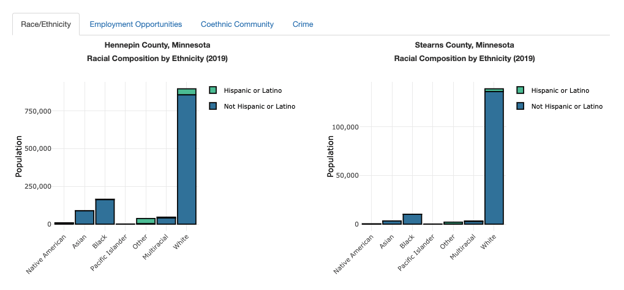
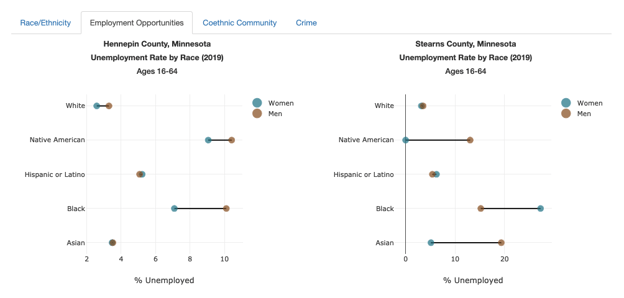
As shown in the charts below, Oluchi highlights, “St. Cloud is less racially diverse than Minneapolis and has a higher unemployment rate for people racialized as Black.”
This data sparked several questions for Oluchi.
“Given that resettlement efforts often view economic self-sufficiency and social ‘integration into American society’ as key indicators of success, what does it mean that this resettled population is growing in an area that, on paper, doesn't seem like it might help accomplish these goals? What other characteristics of life in St. Cloud could be drawing Somali people here as they attempt to integrate into life in the U.S. and establish a sense of belonging? This leaves me wondering about other data that could and should be explored to answer these questions and hopefully improve on the resettlement process.”
The Results
While Oluchi’s analysis provides valuable insight into refugee resettlement in the U.S., there is much more research to be done. To conclude her project, she shared, “What other community characteristics matter as resettled refugees pursue integration and belonging in a new country? The preliminary analyses explored in this app addresses and sparks questions that move us toward a larger line of inquiry: are the differences in locations meaningfully different in ways that influence resettled refugees' decisions to move in pursuit of economic opportunity, social integration, and belonging? The types of questions prompted by the quick comparisons here should be addressed in order to holistically improve the effectiveness of refugee resettlement processes for individuals and communities alike.”
For more insights from Oluchi, visit The Takeaway tab in her Shiny app or her project on GitHub.


