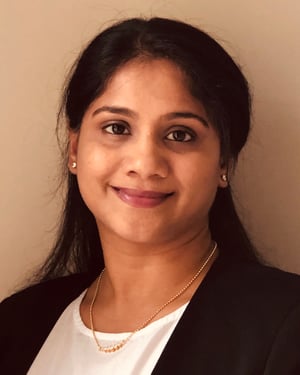
Meet Sunitha
In her 13 years as a software developer, Sunitha Bussa has seen a lot of data and used many different technologies. She has built applications from scratch and supported existing applications. In her current role with the billing department of a dialysis clinic, she works with several reports that are presented in PDFs or spreadsheets. Sunitha saw room for improvement and wanted to create a dashboard, but did not have the proper tools to analyze the data.
The NSS Experience
She decided to explore the field of data analytics and came across Nashville Software School (NSS). She attended the Analytics + Data Science Info Session and learned about the difference between analytics and data science. Her curiosity shifted from analytics to the predictive power of data science. She chose NSS, in part, for the in-person learning environment. The coronavirus pushed classes online for the last three months of her bootcamp, but she appreciated the opportunity to learn in both environments.
As a part of Data Science Cohort 3, Sunitha valued the “hands-on experience with real-time data” and the variety of data problems she learned from during her nine-months. She encourages students to stay organized throughout the course so they can easily refer back to prior lessons.
Capstone Projects
Sunitha’s work at the dialysis clinic inspired both of her capstones. Her mid-course capstone focused on exploratory analysis on patient claims. She explains, “the main goal of the project was to identify the expensive patients and find out reasons why treatments for those patients are more expensive than others.” Using R to explore the data, she identified patients with high expenses and tracked the expenses to patient hospitalizations. She further identified reasons for patients’ hospitalizations from diagnosis codes and labs like albumin levels. You can view her R Shiny dashboard with her findings here.
For her final capstone project, Sunitha researched payments from non-contracted insurance companies. “The project’s main goal was to identify major payors, treatment types, medications and other modifiers contributing toward total revenues,” she explains. “Then, using machine learning algorithms, try to forecast future payments from these major payers for treatment types. I used regression algorithms to identify the key features contributing towards payments and forecast future payments by getting the percentage of charge.” She used R to explore the data. You can view here R Shiny dashboard with her finding here.
Hire sunitha
As Sunitha looks for her first job as a data scientist, she continues to practice what she learned in class by working on a Natural Language Processing project.
You can learn more about Sunitha on her podcast.
Check out all the recent grads on Data Science Cohort 3’s class website and hear the graduates share their experience at NSS and capstone projects in their podcasts below.


