Data Science Cohort 3 student, Bettina Kozissnik, used to be an avid runner and hopes to return to the sport soon. One of her goals motivating her is to qualify and run the Boston Marathon. But has the marathon become more competitive over the years? Bettina wanted to find out.
“Over the last couple of years, the Boston Marathon has become increasingly popular, and it has become more difficult to qualify for a spot,” Bettina explained. “You always had to be slightly faster than the Boston Qualifying Standard in order to qualify, but last year for the first time you had to be at least 4:52 minutes faster than the Standard. This year the Boston Athletic Association (BAA) cut the maximum qualifying time another 5 min (you have to run 5 minutes faster in order to qualify) across all age groups.”
The Data Question
Bettina was curious to learn if the reduction in the maximum qualifying time is affecting re-qualification rates. “How much more competitive did it really get to qualify for the Boston Marathon over the course of the last 10 years and did it make the race faster?”
Cleaning The Data
The biggest challenge Bettina faced in this project was scraping the data off BAA’s website. Once she had scraped the data with Python, her second challenge was “working with time in POSIXct format.” She explained, “calculations in this format do not return time in a date-time format (hh:mm:ss) but instead 1.5 hours.” Bettina was able to use lubridate to parse the dates.
Visualizing The Data
Explore Bettina’s Shiny app, Competitive Boston.
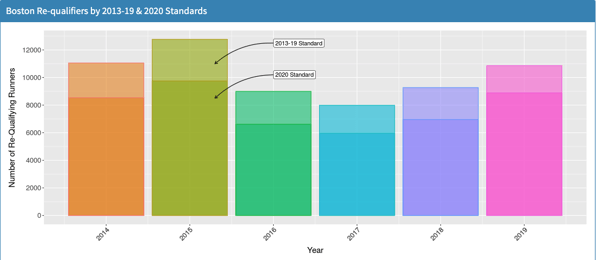
Bettina used ggplots and Plotly to create her visualizations. The first one takes a look at re-qualification rates. “For a non-runner, 5 minutes on a marathon distance does not sound like much,” she explained. “This translates to about a 12 sec/mile increase in speed, but this has quite a dramatic effect on the re-qualification rates at the Boston Marathon, which becomes really clear, when looking at finishing times and re-qualifiers since 2014.”

The decrease in the maximum qualifying time has had a noticeable difference in the number of runners who re-qualify for the Boston Marathon.
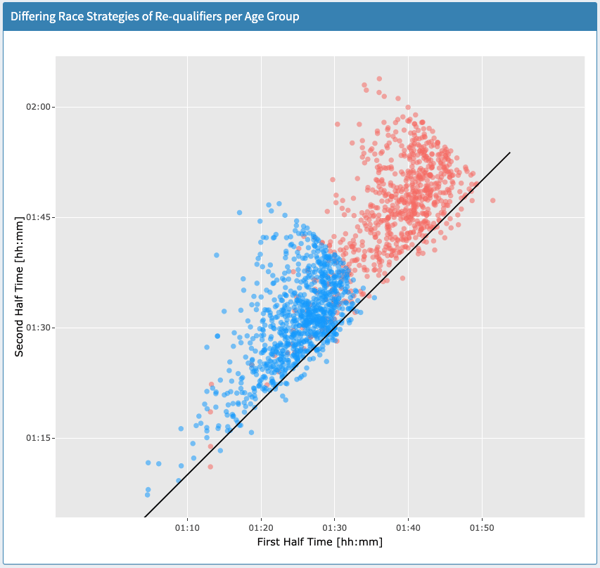
Bettina was also eager to see if she could identify any race strategies among re-qualifiers. To do this, she plotted the half marathon times of the first half of the race against the half marathon times of the second half for the re-qualifiers. “Some marathon wisdom suggests that a constant pace throughout the 26.2 miles is the key to success, while other people suggest ‘negative’ splits are key (running the second half [of the race] faster than the first half).”
The Results
In her race strategies analysis, Bettina found that while a few people actually manage to run the second half of the race faster than the first half, most re-qualifiers run the first half of the race faster than the second half. “This makes sense, especially since most marathon runners ‘hit the wall’ around mile 20 and at the Boston Marathon this is when the aptly named Heartbreak Hill has to be conquered.”

Comparison of speed in the first half of the race versus the last half of the race for re-qualifiers between the ages of 35 and 39.
Bettina’s analysis confirmed that with a faster speed required to qualify and fewer runners re-qualifying for the Boston Marathon, that it is indeed more competitive. We’re cheering her on and hope she will be running the Boston Marathon soon!


