This series features mid-course projects for our Data Science Bootcamp. Students were tasked with asking an interesting data question and finding a dataset to answer the question. Next, they spent time cleaning, wrangling, and exploring the data, before designing and building an interactive Shiny app.
As Nashville’s population continues to grow, traffic congestion has become a big concern for those who commute into the city. For her mid-course capstone, Data Science Cohort 3 student Dalila Paquiot analyzed traffic congestion on I-65.
The Data Question
Does adding traffic lanes reduce congestion? This idea is often mentioned as a way to move more cars through a congested area, but Dalila was curious to find out if it actually makes a difference. “Traffic in Nashville has become increasingly bad,” she shared. “And while there have been efforts to add extra lanes to the highway, is it actually helping to decrease traffic? Did widening I-65 help to reduce traffic? Can this be used to predict traffic for I-440 [which is under construction]?”
Cleaning The Data
To answer her questions, Dalila used data from the Tennessee Department of Transportation (TDOT) and focused on the average speed of motorists on I-65 through the Nashville area. The lower the average speed, the more congested the road. The data included 6 million rows and over 20 columns. Fortunately, the data was fairly clean, but she did have some wrangling to do. “I really had to narrow down what I wanted to reflect in the data and focus on that specific story. I also had to fix time and date issues, narrow down to specific years, etc.” Dalila used tidyverse, dplyr, and lubridate to clean and wrangle her data.
Visualizing the Data
Explore Dalila's Shiny app, Traffic Congestion.
To visualize the data, Dalila used ggplot to create trend lines, scatter plots, and density plots. She analyzed at the data in a few different ways.
- How do special events like holidays or Titans’ games impact the average speed on I-65?
- What is the average speed during morning and evening rush hour?
- And how has the average speed on I-65 changed over time?
The Results
“This project was to analyze and see whether or not widening roads would help congestion. I was surprised to find that it has so far. From the time the construction stopped in early 2016 until late 2019 congestion as a whole has improved.”
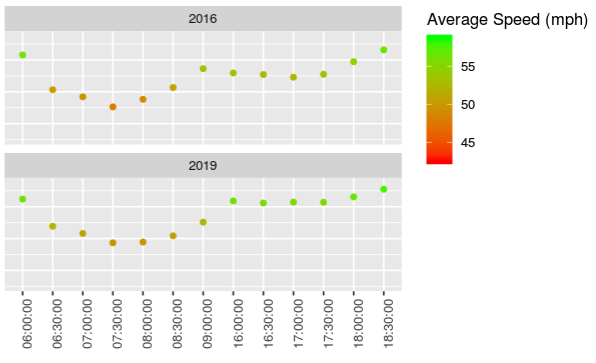
Average speeds have increased since construction ended in 2016.
However, Dalila cautioned, “the improvement in congestion probably will not last as the number of cars using the highway has increased.”
The data also reflected the common perception that traffic will get worse, before it gets better.
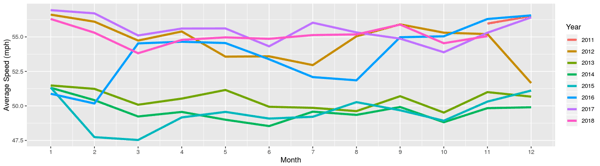 The greatest traffic congestion occurred during construction (2013-2016).
One piece of the traffic congestion puzzle that Dalila intentionally did not evaluate for this project is whether an increase in traffic lanes leads to an increase in vehicles using that road.


