This series features mid-course projects for our Data Science Bootcamp. Students were tasked with asking an interesting data question and finding a dataset to answer the question. Next, they spent time cleaning, wrangling, and exploring the data, before designing and building an interactive Shiny app.
Climate change has been a hot topic for over a decade. Researchers have continued to alert the public about the long-term dangers of rising sea temperatures, an increase in extreme weather events, and even the climate’s impact on the economy. Despite their warnings, there is still sizable opposition to the dangers of climate change. While the opposition’s opinion is rarely swayed by ecological impacts, like disappearing coral reefs, the economic impacts of climate change may change some of their minds.
The Data Question
Jerry Igiozee explored the effect of climate change on economies for his mid-course project. He had two assumptions going into his research:
-
Regions prone to extreme weather events will experience a larger negative impact from climate change over time.
-
Countries with stronger economies will see better results than countries with weaker economies.
His final hypothesis was that the effect of climate change on an economy “depends on the policies in place in a city, state/province, or country.”
Cleaning The Data
“It is very easy to get lost in the sea of data with climate change,” Jerry shared. So he focused his research on climate change economics. “The main challenge for cleaning the data was merging different datasets together. Since the majority of the data I used came from scientific papers, just reading the methods that the authors took helped clear any confusion,” he explained. He used tidyverse to clean the data.
Visualizing The Data
Explore the Climate Change data in his Shiny app.
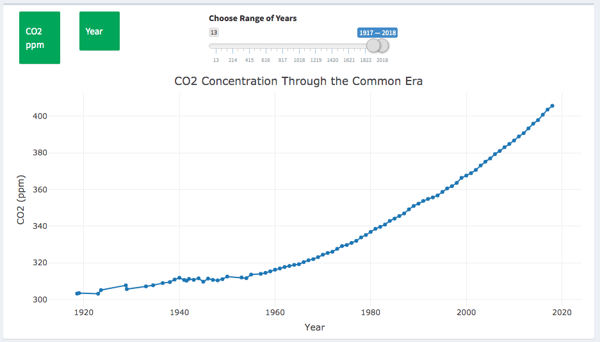
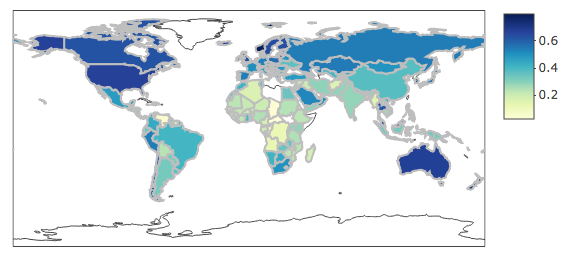
Jerry created his visualizations with Plotly. To show trends and projections for climate change over time, he used scatterplots. He used choropleth maps to show how climate change has affected each country over time.
Economic Readiness 2016
The Results
Jerry discovered how drastic carbon dioxide has increased during the past 100 years and how it has affected grain production. He also found that developed countries are more prepared for climate change than developing countries.
Concentration of Carbon Dioxide from 1917-2018