This series features mid-course projects for our Data Science Bootcamp. Students were tasked with asking an interesting data question and finding a dataset to answer the question. Next, they spent time cleaning, wrangling, and exploring the data, before designing and building an interactive Shiny app.
UrLeaka Newsome’s midcourse capstone project was inspired by a podcast where the guest drew a comparison between consumer spending on health and beauty aid products and health disparities for certain population groups. She explored this claim and learned that research has found a connection between phthalate metabolites and obesity, reproductive and developmental disease, and disorders. Phthalates are industrial chemicals found in plastic products, personal care products, and food packaging.
The Data Question
If phthalates are linked to health issues, could different population groups be impacted differently based on the products they buy? The first step to answering this question was to look for a potential relationship between phthalate metabolites and health disparities among population groups in the United States.
Cleaning The Data
UrLeaka worked with a large data set from the National Health and Nutrition Examination Survey (NHANES). She used data from 2015-2016 for individuals 18 years of age and older and was able to link several files in the data set together based on the patient code. She shared, “in addition to the challenge of getting the files to ‘talk’ to each other, correctly categorizing and grouping the information took a lot of time in order to accurately display and summarize the data.” To clean her data, she used the R packages tidyverse, dplyr, haven, and broom.
Visualizing The Data
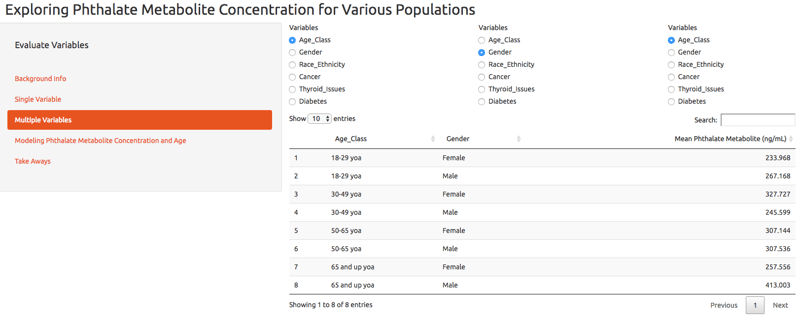
View her Exploring Phthalate Metabolite Concentration for Various Populations app.
For her visualizations, UrLeaka graphed the mean phthalate metabolite for several variables, including age, gender, ethnicity, and diseases and disorders like cancer, thyroid issues, and diabetes.
She also created a multi-variable table to compare the mean phthalate metabolite among different groups.
The Results
UrLeaka found a few differences among the population groups. “Surprisingly, there seemed to be a noticeable difference in the phthalate metabolite concentration for certain groups. Men, individuals over the age of 65, and non-Hispanic Black individuals appeared to have a higher amount of phthalate urinary concentration,” she shared. “In addition, there were 11 individuals in the study that had an exponentially higher amount of phthalate metabolite concentration. If these outliers were removed, similar results would still reveal a slightly higher amount of phthalate concentration for non-Hispanic Blacks. Individuals that were 65 years of age and older and individuals that were between 30 and 49 in age had about the same average phthalate concentration.”


