This series features mid-course projects for our Data Science Bootcamp. Students were tasked with asking an interesting data question and finding a dataset to answer the question. Next, they spent time cleaning, wrangling, and exploring the data, before designing and building an interactive Shiny app.
Stack Overflow is a question and answer forum that connects programmers from around the globe to help each other troubleshoot. Users can ask questions, share solutions, and search topics based on tags.
The Data Question
As a frequent user of both the English version of Stack Overflow and it’s Russian counterpart, Sergey Motorny was curious to see if there were any trends when comparing tags between the English and Russian language versions of Stack Overflow.
He also defined a hypothesis to evaluate:
-
Null Hypothesis: Russian and English tags on Stack Overflow belong to the same population group (Russian Stack Overflow is simply a smaller subset of the same tag space).
-
Alternative Hypothesis: Russian and English tags of Stack Overflow represent two different population groups (with distinct tags and popularity).
Cleaning The Data
Sergey’s data source, StackExchange Data Explorer, keeps their data clean and ready-to-use. Paired with a well-defined query, there was not much data cleaning left to do.
However, he did need to transform the data into proportions so that the two Stack Overflow communities could be compared. He used dplyr to accomplish this. Sergey explained, “[Transforming the data] was probably the biggest challenge for this project. The Russian community does not have as many tags because it is smaller, so I had to find a way to make the tags be comparable. Otherwise, it looked like JavaScript, for example, was much more popular on Russian Stack Overflow than on the English version, which is not the case.”
Visualizing The Data
See Sergey’s Shiny app, Visual Tag Analysis of Russian and English Stack Overflow Communities.
He started his visualizations with ggplot, but switched to ggplotly to add interactivity to the graphs. “I find that having features, such as a clickable legend, positively impacts user experience,” shared Sergey.
The Results
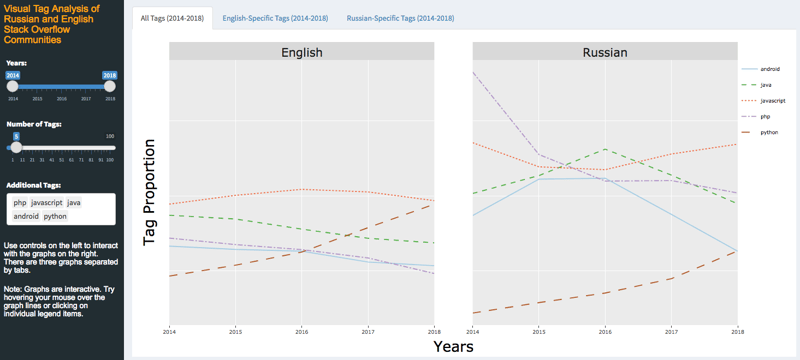
Sergey found several similarities between the English and Russian-speaking communities of Stack Overflow. “For example, JavaScript is the most popular tag whether you visit the Russian or English-speaking site,” he explained. He discovered that data science tools like R, Pandas, and Matlab were not on the Russian Stack Overflow. “This is something I would like to explore further,” he shared. “Is there a different place for these conversations in Russian, or is the level of interest generally low? It was also interesting to see that Russians discuss such IT infrastructure pieces as Ubuntu Linux or Nginx much more frequently.”
Additional statistical analysis is needed to confirm or reject his null hypothesis.


