Smita Misra Upadhyay is passionate about improving treatment plans for breast cancer through her research. She shared, “breast cancer is the second most common cancer in women, after skin cancer. Female breast cancer represents 15% of all new cancer cases in the U.S. Researchers are studying how molecular subtypes of breast cancer may be useful in planning treatment and developing new therapies.”
In her own research, she discovered the Novel protein ZAR2. ZAR2 regulates the expression of the breast cancer type 2 susceptibility protein (BRCA2), a tumor suppressor found in breast cancer, and another protein involved in tumor progression and metastasis.
One challenge Smita has experienced in her research is actually too much data. With new studies being published every day, it can be difficult to understand the big picture with all the minute details.
“That’s where, I think, data science comes in,” Smita stated. “We have a lot of data due to the reduced cost of doing global genome-wide analysis of the genome sequencing, transcriptome analysis, proteomics, metabolomics etc. But the problem is how to derive relevant human readable and easily decipherable pictures. Nowadays, with growing knowledge that no two individuals are identical and thus the treatment, even for same cancer, cannot be identical, it is very import to understand the personalized differences and design treatment, not only for the basis type of cancer but also an individual’s response to the treatment, which can vary with a lot of parameters including but not limited to race and ethnicity.”
Through her research, Smita hopes to understand “the molecular differences between subsets of breast cancer and how within subsets, other key players (RNA and Protein) contribute towards treatment strategies.”
The Data Question
The Cancer Genome Atlas (TCGA), an effort led by the National Institutes of Health, was formed to gain an understanding of the molecular basis of cancer through genome analysis and characterization technologies. The goal is to advance personalized medicine by understanding the tumor at the molecular level and create better treatments that target the molecular subtype of the cancer.
For her mid-course capstone, Smita set out to develop a predictive model for treatment choice based on the molecular subtypes and transcriptome profiles in breast cancer. She explored three datasets from The Cancer Genome Atlas, the National Cancer Institute Genomic Data Commons (http://cancerrxgene.org), and the Sanger Centre.
She looked into the clinical profile of TCGS’s invasive breast cancer dataset and pulled out the similar or identical pairs with age, ethnicity, gender, and treatment options. She then looked into the expression dataset to see changes in the expression profile of the patients and then predicted treatment combinations.
Cleaning The Data
Smita used xml parsing to download the data, which contained several nested tabs, and created a dataframe. Readxl helped convert the xl data to the dataframe. She used R to clean the xml data and dplyr was used for data wrangling and curation.
Visualizing The Data
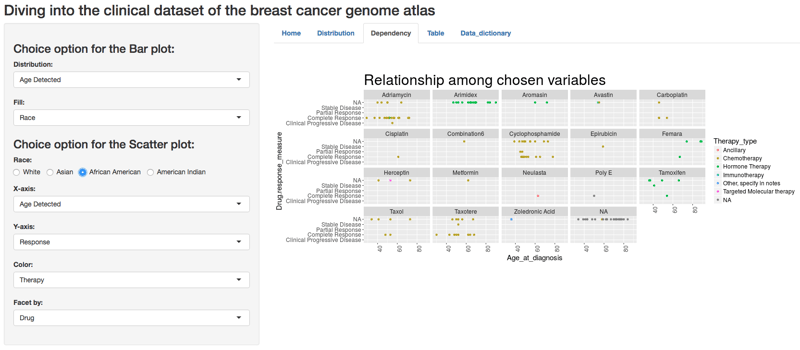
She used ggplot2 and plotly to show the correlation and distribution of breast cancer subtypes for receptor status, stage, and treatment vital status among caucasian, African American and Asian races. Check out Smita’s Shiny app, Diving into the clinical dataset of the breast cancer genome atlas.
Treatment Options and Response in African American Patient Population
The Results
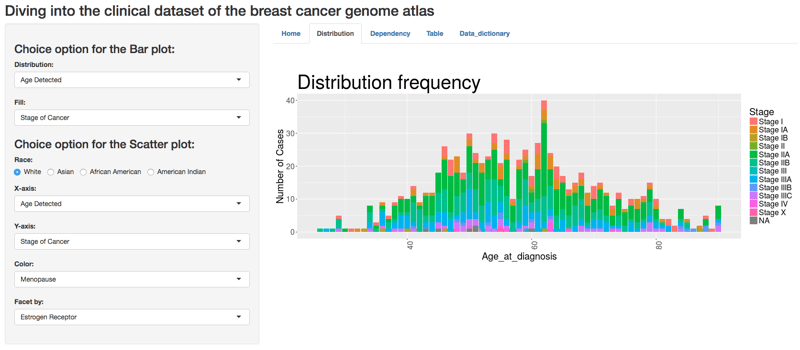
“The expected goal was not completely reached because I wanted to drill down to the molecular level,” Smita explained. “But I did see that cancer is not only a late age disease; it can be detected in younger (people) and with a more severe stage. Most of the cases in the study did fall between 40-60 years of age.”
Distribution of Various Grades of Breast Cancer by Age
“Males also have breast cancer,” she continued. “We noticed that a relative percent of African American triple negative breast cancer cases are more prevalent in the data set than white counterparts. We noticed a lot of differences among the treatment choice between different types of cancer in different races. Achieving complete pathological response was also rare in the dataset.”


