This series features mid-course projects for our inaugural Data Science Bootcamp. Students were tasked with asking an interesting data question, finding a dataset to answer the data question, cleaning, wrangling, and exploring the data, then designing and building an interactive Shiny app.
Have you thought about how changes in our climate might impact the spread of disease? With his background in biology and interest in global health and the climate, Sanjay Mishra wanted to know if the expanding geography of warmer seasons is allowing the vector population (mosquitoes, ticks, flies) to grow more rapidly, and thus increasing the rate of vector-borne diseases, such as West Nile Virus, Dengue, and Zika, or causing them to occur in new regions.
The Data Question
Sanjay narrowed the scope to two questions:
- Are there global trends in the increase of vector-borne diseases?
- Are vector-borne diseases becoming more prevalent with global warming?
He shared, “In a study published almost two decades back (Githeko, Lindsay, Confalonieri, & Patz, 2000), it was suggested that inter-annual and inter-decadal climate variability have a direct influence on the epidemiology of vector-borne diseases. In a more recent report (Beard, et al., 2016), it is cautioned that rising temperatures, changing precipitation patterns, and a higher frequency of some extreme weather events associated with climate change will influence the distribution, abundance, and prevalence of infection in the mosquitoes. Using more extensive and updated data, this project attempted to visualize the tenets of the hypothesis, and find a ‘smoking gun.’”
To find the answers, he used several data sources, including, a decade’s worth of data on diseases in the United States from the Center for Disease Control (CDC), epidemiological data on diseases from the European Centre for Disease Prevention and Control (ECDC), the GISS Surface Temperature Analysis (GISTEMP) repository which provides an estimate of global surface temperature changes, and global data on vector-borne diseases from the World Health Organization (WHO).
Fortunately, the climate data Sanjay chose was very usable, but it was a massive amount of data which required him to filter down to the relevant information. He used the readr and readxl libraries in R to load the data he collected.
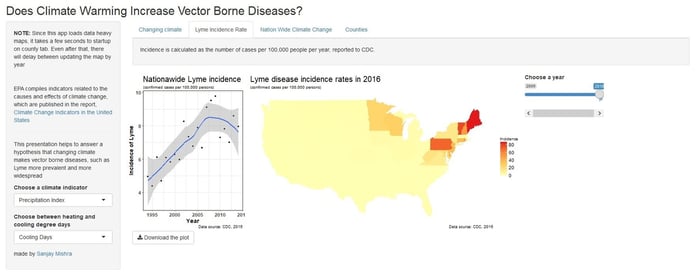
I used CDC datasets that contained county-by-county Lyme incidence and the Census Bureau county (FIPS) shapefiles
file1 <- "data/Lyme_ld-Case-Counts-by-County-00-16.csv"
file2 <- "data/US_FIPS_CountyCodes.xls"
Lyme <- read_csv(file1)
FIPS <- read_excel(file2)
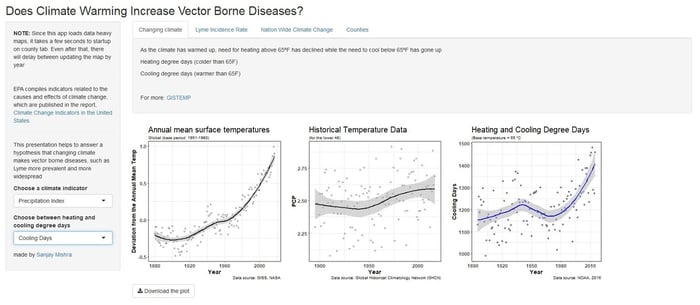
He chose to use ggplot and tmap for his visualizations with the goal of showing that the warming climate and increasing precipitation correlate with increasing incidences of Lyme disease. ggplot and tmap created outputs that are good for the user to print.
The Results
Sanjay shared, “I learned that most parts of the country have gotten warmer over the century, and while some parts of the country are facing drought, other parts are getting higher than normal precipitation. Also, I learned that Lyme disease has had a steep rise over the last two decades.”
Time and resource limitation prevented him from being able to determine that a change in the climate is causing the increase in Lyme disease, but he has updated his hypothesis. He elaborated, “The hypothesis that one could test is that black-legged ticks which are the carriers of the Lyme causing bacteria will thrive in a window of higher humidity and moderate temperature. Since the Northeast is getting more precipitation than the median, it should be more humid now than before with longer summer-like temperatures. The combination of higher than normal precipitation and longer summer-like weathers will allow ticks to breed more which means the nymphs will be more frequent than before. It’s the nymphs that are primary spreaders of the disease. However, it is speculative on my part, and I don't have enough analyses to support it. At present, all I have is the correlational maps, that show overlapping conditions and the incidence.”
As a result of his research, Sanjay now has a better understanding of the data available on vector-borne diseases and climate information and has a new hypothesis to pursue.
Referenced Works:
Beard, C., Eisen, R., Barker, C., Garofalo, J., Hahn, M., Hayden, M., et al. (2016). Vectorborne Diseases. The Impacts of Climate Change on Human Health in the United States: A Scientific Assessment. Washington, DC: U.S. Global Change Research Program.
Githeko, A. K., Lindsay, S. W., Confalonieri, U. E., & Patz, J. A. (2000). Climate change and vector-borne diseases: a regional analysis. Bulletin of the World Health Organization, 1136 - 1147.


