This series features mid-course projects for our inaugural Data Science Bootcamp. Students were tasked with asking an interesting data question, finding a dataset to answer the data question, cleaning, wrangling, and exploring the data, then designing and building an interactive Shiny app.
Intrigued by Nashville’s significant economic growth in recent years and increased accessibility of data from the State of Tennessee, Paulo Martinez wanted to see if there was a correlation between the allocation of financial resources to school districts and educational outcomes, using ACT scores. Is the recent economic growth impacting the achievement gap in Tennessee? And is this increased revenue being distributed equally across school districts?
The Data Question
After reviewing his data, Paulo set out to answer these three questions:
- Is the data released by Tennessee’s State Government sufficient to determine how each Tennessee school district is funded?
- Considering results published by ACT, The Washington Post, and The Huffington Post: how well can the correlation between a school district’s financial variables and its ACT-composite scores be measured in Tennessee?
- How well can the correlation between a Tennessee student’s academic outcomes and their family income (both historically measured and projected) be measured?
He hypothesized, “considering Tennessee’s history of racial segregation and discrimination, especially in the education system and real-estate systems, I expect to find disparities in financial resources, and thus their corresponding repercussions on educational outcomes and social mobility to correlate to racial demographics (but also to white economically disadvantaged white populations). However, how much this correlation and its evolution can be measured
longitudinally remains an open question at this time.”
Before he could begin to answer any of his questions, Paulo had to learn how to work with shapefiles from the U.S. Census Bureau and the National Center for Education Statistics. He utilized RGDAL, an R package for reading, cleaning, and manipulating shapefiles. After accessing the attribute-tables (data-frames) from the shapefiles, he had to find a variable that would allow him to merge them with the educational data from tn.gov/education/data. He found RGDAL helpful in joining the data frames to the shapefiles. Paulo used the R package Tidyverse to clean and manipulate the data frames. He shared, “it’s great because it uses pipe operators for a more organic human-readable code.”
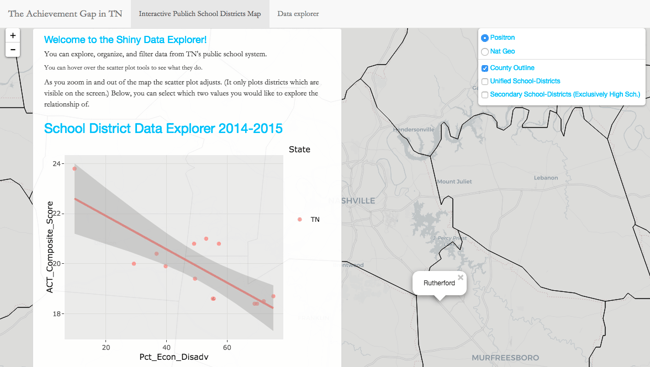
When deciding how to visualize the data for his app, The Achievement Gap in TN, Paulo approached it with the following goals in mind: “make it easy for Tennessee public education stakeholders to ‘see the big picture,’ see how this huge complex system fits together, and find the impact it is having on Tennessee students and families.” To convey these messages, he used an interactive scatter plot so users can filter, group, and measure the correlation of education variables. He utilized leaflet, an R package that uses the JavaScript Leaflet library for making highly interactive maps that allows panning and zooming. He shared, “my favorite features were the ability to code ‘hover and click’ tool-tips-events as well as giving the user the option to select which polygon layers to click on or off.”
The Results
School districts with higher rates of economic disadvantage tend to do worse on the ACT. -Paulo MartinezThrough his analysis, Paulo found a strong correlation between the financial resources for school districts (broken down to dollar per student) and student’s ACT scores, revealing an apparent ACT-achievement gap in Tennessee.


