This series features mid-course projects for our inaugural Data Science bootcamp. Students were tasked with asking an interesting data question, finding a dataset to answer the data question, cleaning, wrangling, and exploring the data, then design and build an interactive Shiny app.
Before becoming a software developer, Taylor Perkins was a musician who dreamed of making money on his laptop while touring with his band. Now a student in our Data Science bootcamp, Taylor knew his mid-course project had to involve music.
The Data Question
Taylor wondered, “What makes a great song? What makes a popular song? Is there some secret formula that just draws in listeners?” He hypothesized that the energy and key of the song are important factors for a popular song. He explained, “I believe that there are similarities in song format structure that draw people in.” Inspired by an article about lyric repetition, Taylor set out to find out the role the tone, key, and energy play in a song’s popularity.
To answer his questions, Taylor used data from Billboard’s API and Echo Nest / Spotify APIs. He explained his process of cleaning the data, “Using a blend of Python and bash scripting, I was able to pull the data I needed for the top 100 songs for every week between the years 2000 and 2016. Billboard's dataset gave me the dates and ranks associated with each song, whereas Echo Nest / Spotify gave me the in-depth song attributes.” He used the R package dplyr to clean the data.
When it came time to work on the visualizations, Taylor realized he had too much data. To lighten the load, he reduced it to 4 key parts: description (artist and song title), instance date, song rank, and seven Echo Nest fields. He chose to use three graphs to visualize the data.
- A histogram that displays the basic value frequency
- A box plot to look at each variable by year
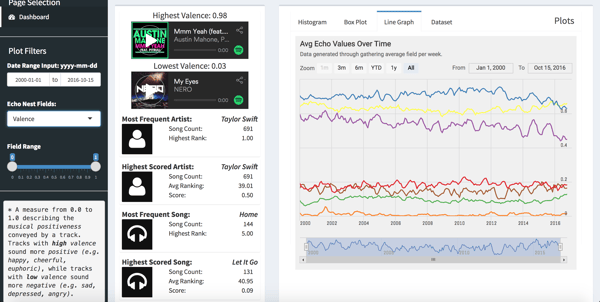
- A line graph with each color representing an Echo Nest field over time.
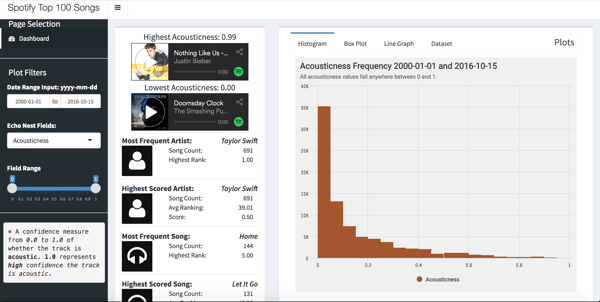 To give his app more context, Taylor displayed some additional information relative to the user-defined filters. He included the most frequent artist and song, calculated by the number of times an artist or song appeared in the Top 100 songs within the user-defined date range, and highest scoring artist and song (based on frequency and rank within the user-defined date range).
He also included Spotify audio players that allow a user to hear the difference between the high or low value of the chosen Echo Nest value, such as Energy. If you filtered your search on “energy,” the Spotify players would allow you to play the highest and lowest energy songs in your filtered dataset. “For example,” he explained, “what does a song with high energy sound like? Low valence? The song with the highest danceability value?”
The Results
Taylor discovered some fun results. He shared, “Glee shows up more times than any artist in this dataset! Which is pretty funny. The average valence levels (the likelihood that a song is either positive or negative) is dropping (from 68% to around 45%), whereas the average danceability for songs is increasing by that same amount. I think that the increase in popularity of electronic / pop songs (you would hear played in clubs) with a lack of vocals can be seen by this trend.”
Taylor plans to continue working on this project.


