This series features mid-course projects for our inaugural Data Science bootcamp. Students were tasked with asking an interesting data question, finding a dataset to answer the data question, cleaning, wrangling, and exploring the data, then design and build an interactive Shiny app.
Have you heard of the Bechdel Test? It was popularized in 1985 by Alison Bechdel’s comic Dykes To Watch Out For. The test is a simple three point check that examines the gender imbalance in movies. To pass the test, a movie must meet the following criteria:
- There are at least two named women in the picture.
- They have a conversation with each other at some point.
- That conversation isn’t about a male character.
Shruti Sharma decided to examine the Bechdel Test for her mid-course project. She explained, “I think it is an insightful way of looking at the issue of gender imbalance and how skewed its representation in pop culture is. Role models are incredibly helpful. You cannot be what you cannot see. It is also something that is simple enough to illustrate the point.”
The Data Question
Shuti set out to answer the following questions:
- How does the Bechdel Test score trend change based on genre, gender of the director, or budget?
- And how does it trend over the years?
To answer these questions, Shruti used data from IMDB and an API from bechdeltest.com that includes movies with their ratings. To prep the data, she used the python jsonlite package to make a pandas DataFrame with over 7k movie scores from the bechdeltest.com API. Shruti joined this data with the IMDB data set to predict the gender of the director. The gender-prediction package help her analyze the IMDB data to determine whether the director was male or female.
She described the tools that she used, “The gender package encodes gender based on names and dates of birth using historical datasets. Its function predicts the gender of a first name given a year or range of years in which the person was born. The prediction can use one of several data sets suitable for different time periods or geographical regions. By using these datasets, this package is able to more accurately guess the gender of a name, and it is able to report the probability that a name was male or female. I used this by using U.S. Census or Social Security data sets. It requires a separate download of datasets, which should be done automatically and can be done manually by running install_genderdata_package().”
She used tidyverse and dplyr in R to group, sort, filter, and aggregate the datasets for her visualization. She was able to create visualizations that respond to filters by coupling ggvis with reactive. She shared, “I like the ability to use tooltips and hover functions inside the library that make it more interactive and informative.” She liked working with Shiny as well. “All (of the) extensive examples and documentation allows a user the independence to concentrate on the data without the hassle of setting up pages and code specific responsive elements in the visualization,” she said.
The Results
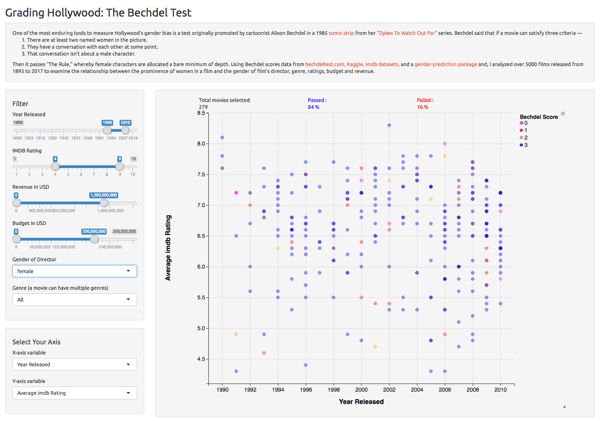
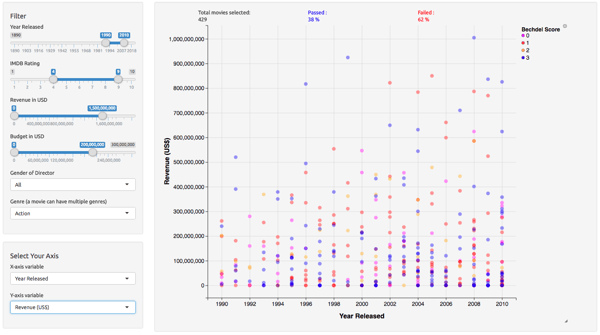
So what was Shruti able to glean from this analysis? For movies with female directors, the percentage that pass the Bechdel Test is way over average. Movies that are plot-driven (e.g. action or crime) performed worse than character-drive movies (e.g. drama or romance). While these results were expected, Shruti found the validation interesting.
You can explore Shruti’s data in her app, Grading Hollywood: The Bechdel Test.


