This series features mid-course projects for our Data Science Bootcamp. Students were first tasked with posing an interesting data question and finding a dataset to address that question. Next, they spent time cleaning, wrangling, and exploring the data, before designing and building an interactive Shiny app to display their findings and allow for further exploration.
Medication Administration Records (MARs) are reports that serve as a record of the medications a patient is given. However, when drugs are administered to patients with intellectual disabilities, they often cannot vocalize side effects and reactions to medications. Additionally, doctors do not usually know all the risks and side effects to the drugs that they are prescribing, and can prescribe drugs that unknowingly increase certain side effects.
For his mid-course capstone project, Jacob Parks of Data Science Cohort 5 was approached by the therapeutic services coordinator for the Tennessee Department of Intellectual and Developmental Disabilities of East Tennessee (DIDD) to construct a Shiny app to improve the information provided on a patient's MAR. “The main goal was to construct an app that can group medications that a patient is taking and be able to show [a complete list of] risk factors and side effects associated with these medications,” he explains.
The Data Question
Jacob’s primary data question asked “how can we present data about drugs to improve care of patients?” To answer this question, he created his mid-course capstone application for DIDD to help medical providers supplement medical administration records with more comprehensive data about prescription drugs and their risks.
Cleaning The Data
Jacob shared that the biggest challenge he faced while creating his project was gathering all of his data. “It took me about a week to gather all of the data necessary to complete the project,” he explains. “I began with a couple of resources that were given to me by the Department of Intellectual and Developmental Disabilities.”
It turned out that those resources were a great place to start as Jacob shares that he actually didn’t end up having to do much cleaning on these data sets. “These resources included the data about foods' nutritional information and prescription drug names. There were a few confusing labels in the data, but these were easy to clean up with data dictionaries and pandas.” However, he soon realized that gathering data about drug side effects would not be as simple as his first data set. “I scoured the internet for drug side effects databases, and landed on drugs.com,” he shares. “This website contained information about drug side effects scattered across thousands of web pages.”
Jacob then began to web scrape the data using the prescription drug names he already had, which he says took him about a week to develop and improve the web scraping code. “When it was finished, the code itself took about 6 hours to run, and I ended with nearly 120,000 side effects gathered for over 3,600 drugs. I cannot describe the sense of relief when my code finally ran and I saw my complete data for the first time,” he says.
I did a lot of my data cleaning in Python before I moved to R. In Python, I used requests, Beautiful Soup, and Pandas to create and clean my tables, before moving them to R.
Visualizing The Data
Jacob shares that he knew exactly who his target audience should be from the conception of his mid-course capstone project, so determining how to present his data through visualizations was the easy part. “This app was designed for medical care providers within the Tennessee Department of Intellectual and Developmental Disabilities, so I did not want to go really in depth with complex visualizations,” he explains.
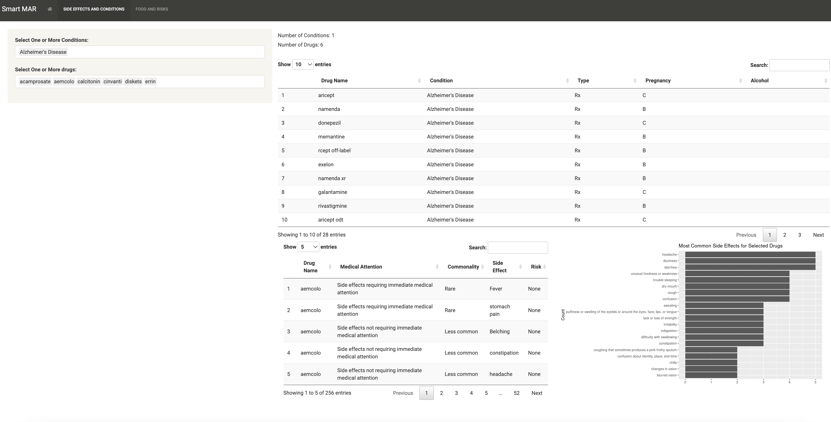
On the first tab, the application presents data about different classes of medications, medication side effects and shows what medications are used for certain diagnoses.
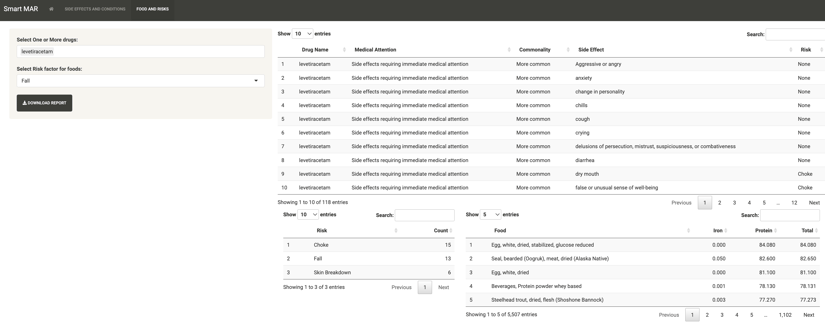
Displayed on the second tab are foods that will help mitigate side effects of selected medications.
Jacob kept visualizations simple and intuitive in order for users to gain instant insights for what type of side effects they might see from a certain prescription drug or combination of prescription drugs. “For plots, I used the ggplot library. For my tables, I wanted users to have a lot of flexibility in what they were able to see, as different users might be interested in different things,” he shares. Within the tables users can search, filter and sort based on a specific side effect, drug, food, or risk factor.
The Results
“One interesting thing I learned did not come from the data, but came from my research into the project,” Jacob shares of his findings. “There are not many apps available that can give quick, useful information about the risks of polypharmacy.” He explains that while it is very well known that there are a lot of risks in polypharmacy, a lot of care providers do not have a resource allowing them to really categorize and see these risks accurately, and see methods to mitigate these risks.
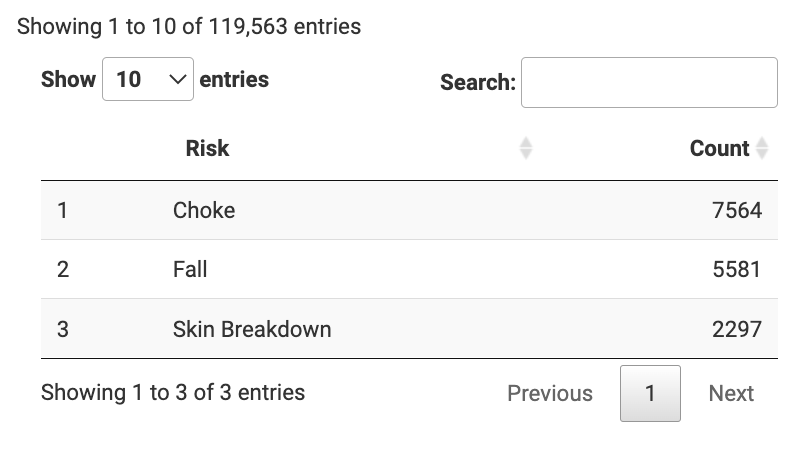 “Another interesting thing I learned was that the most common risk factor for the medications I had data on was choking.” When he initially looked at the data, Jacob saw that some of the most common side effects were something that he thought would lead to falling. “I typically think of falling as a severe risk from taking a lot of medication, but I had never heard a lot about choking! It was an interesting insight, and I hope that this app can help mitigate the risk of these types of incidents in the future.”
Learn more about Jacob’s project when you visit his GitHub Repo.


