This series features mid-course projects for our Data Science Bootcamp. Students were first tasked with posing an interesting data question and finding a dataset to address that question. Next, they spent time cleaning, wrangling, and exploring the data, before designing and building an interactive Shiny app to display their findings and allow for further exploration.
As a microbiologist, Alex Zhang of Data Science Cohort 5 decided to create a Shiny app for his mid-course capstone that helps the general public and government officials understand the risk of COVID-19 and vaccination progress in the U.S. by providing up-to-date data for making COVID-19-related policy decisions for public health.
“My research [as a microbiologist] is focused on infectious disease and prevention by vaccines,” he explains. “COVID is the largest pandemic since the Spanish flu pandemic 100 years ago. It profoundly changed the world and our daily life. I believe it is extremely important for individuals, healthcare organizations, and governments to keep track of the up-to-date information of COVID epidemiology and vaccination to make good health-related decisions and policies, which could hopefully move us past COVID pandemic.”
The Data Question
Alex’s first goal was to create an app allowing the user to easily understand the current status of COVID-19 related cases, hospitalization, death, and vaccination hesitancy and progress at the U.S. county level. He then wanted to see if there were any correlations between these key indicators. Alex’s final goal was to search for disparities or inequalities of COVID-19 related cases, hospitalizations, or deaths across different categories of metro statuses, the Centers for Disease Control’s (CDC) Social Vulnerability Index, and the COVID-19 Vaccine Coverage Index.
Cleaning The Data
With the data questions guiding Alex, it was time to gather and clean his data. He began by downloading the geospatial data of U.S. counties in shapefile from ArcGIS Hub. Alex acquired regularly updated COVID-19 epidemiology and vaccination data from the CDC and Health and Human Services (HHS) via APIs. Alex then joined the data to link the geospatial data with COVID-19 data. New variables, such as the percentage of those that have received a vaccine booster in different age groups, were created using the existing data in the dataset.
“The biggest challenge was that the Shiny app ran very slowly when loading and refreshing the county map,” Alex shares. “With the help from our lead instructor Michael Holloway, I simplified the polygons of the counties’ shapefile using the ms_simplify function of the rmapshaper package and wrote the simplified polygons to RDS, a file that stores a single R object. R reads the RDS file very fast, so the Shiny app runs much faster than it did originally.”
Thinking carefully about how to create a user-friendly application, Alex cleaned up the variable names that came through the API by removing underscores and converting them to human-friendly versions. “The variable names contain underscores and are not appealing for presentation in visualizations. I had to create a series of labels to properly present variables of the data in maps and figures,” he explains.
Visualizing The Data
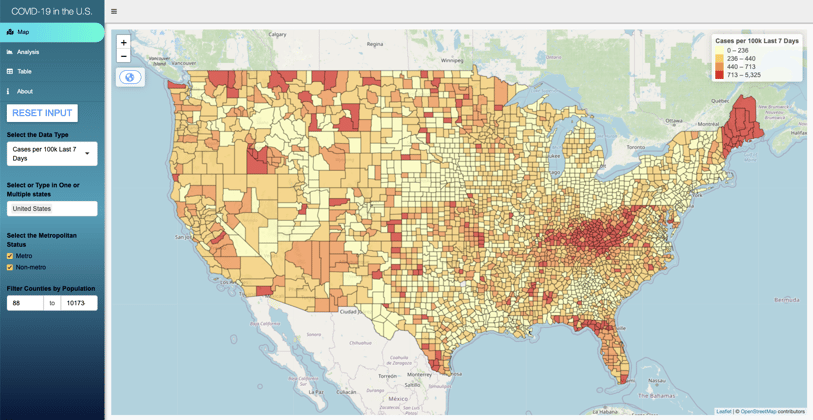
Alex’s Shiny app uses a map of the U.S. created with the Leaflet package to present the COVID-19 epidemiology and vaccination data as an intuitive visualization. Users can compare COVID-19 data among counties across the nation, such as tests, cases, hospitalizations, deaths, vaccination percentage, vaccination hesitancy, COVID-19 Vaccine Coverage Index, and Social Vulnerability Index.
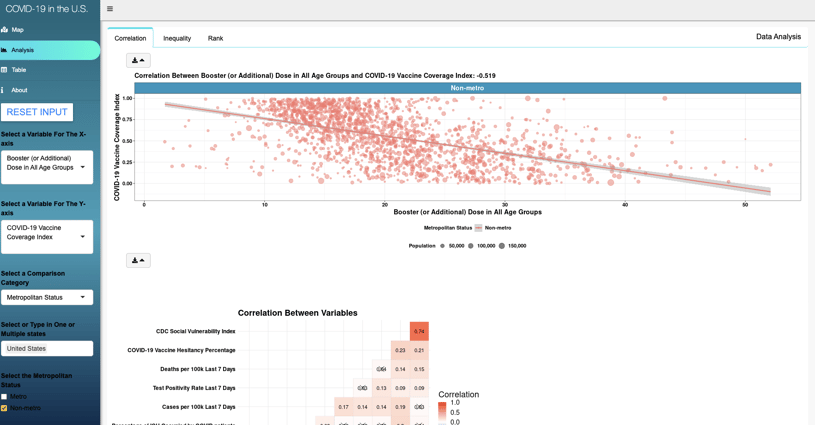
The second tab of his application helps the user to understand relationships between the variables that Alex had gathered. “I used faceted scatter plots and heat maps to compare the correlation of variables in the context of metro status, COVID-19 Vaccine Coverage Index, Social Vulnerability Index, and population,” he explains. 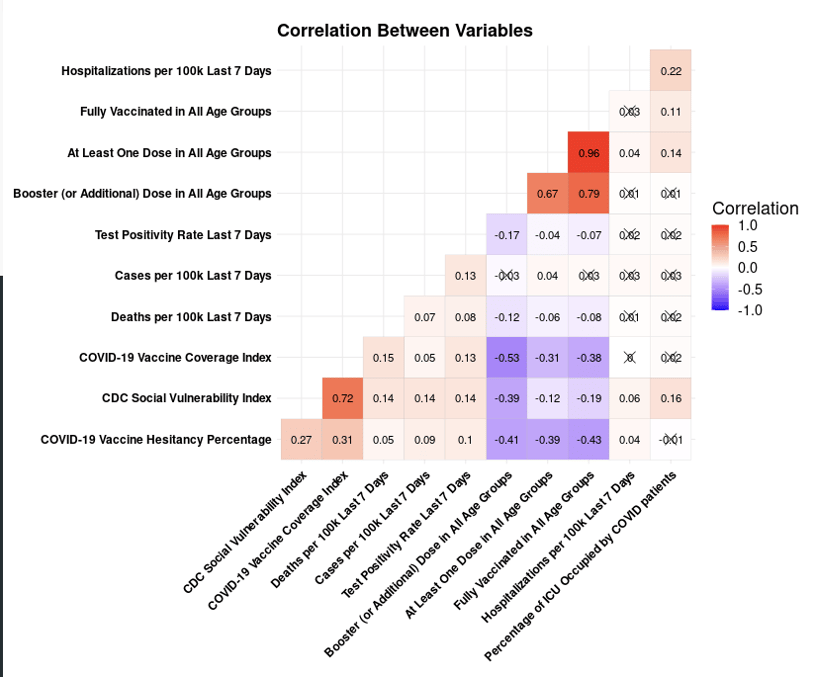
The bar charts in the app’s interface are used to analyze the disparity/inequality of important epidemiology and vaccination indicators in the four contexts (mentioned above) while the value boxes show key epidemiology and vaccination indicators and bar charts to rank the counties and states by these indicators. “The scatter plots, heat map, and bar charts were created by the ggplot2 package and downloadable as png files,” he shares.
The Results
“The COVID-19 epidemiology is still very dynamic, and the geographical pattern of key epidemiology indicators may change regularly due to the emergence of new coronavirus variants,” Alex says of his analysis. “The vaccination percentages of U.S. counties are relatively more stable and progress at a steady rate, although the progress is not equal in different areas of the country.”
According to Alex’s data analysis on the correlations of different vaccination statuses, counties with a higher percentage of receiving at least one dose of vaccine tend to have a higher percentage of being fully vaccinated and receiving the vaccine booster. “The elderly population above 65 years of age, who are most susceptible to COVID-19, have the highest vaccination percentage compared to all other age groups,” he notes. “Counties with a high COVID-19 Vaccine Coverage Index and Social Vulnerability Index tend to have low vaccination percentages.”
Alex also mentions that metro counties tend to have lower vaccine hesitancy and higher vaccination percentages compared to rural counties in the U.S..
Check out Alex’s project on GitHub or his Shiny app for more insights.


