The R programming language is known for statistical computing, but it also has a great tool for building interactive dashboards with the Shiny library. The students in Data Science Cohort 5 built Shiny dashboards for a project with the accounting firm Hauser Jones & Sas. One of the specialties of Hauser Jones & Sas is auditing banks, and the students were tasked with creating a dashboard that would help in that capacity.
To start, the students pulled data from the Home Mortgage Disclosure Act (HMDA) website and used that to characterize different regions along multiple dimensions, such as ethnicity/race, gender, age, familial status, approved loans, and dwelling category. The dashboard uses that information to allow users to look at different lending institutions, geographic areas, and filter by gender/race/age/disability to compare with peer institutions.
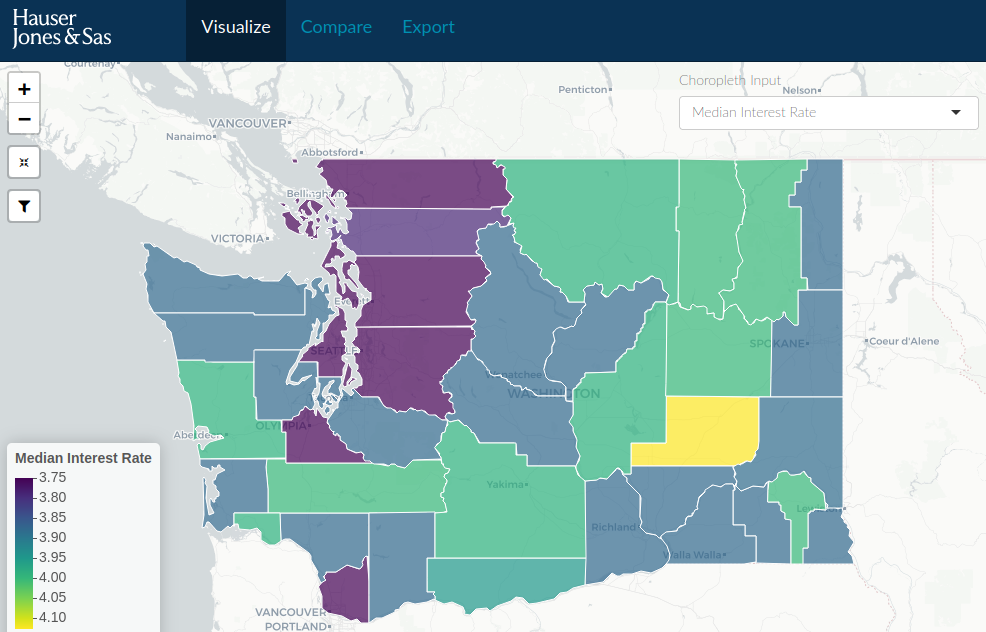 Median mortgage interest rate for each county in Washington State. Cool colors are lower interest rates and warm colors are higher interest rates.
These kinds of partner projects are wonderful learning opportunities for students because it allows them to work through real-world projects and see how companies use data to address business needs. One real-world aspect of the project was dealing with large amounts of messy data. Chris Harrelson noted that he “learned how to wrangle web APIs and do general data engineering in R in this project--particularly with respect to how to make my code efficient given the amount of data.” The students used data from multiple sources, including the HMDA and US Census websites. Rohit Venkat enjoyed immersing himself in the data. “My background is not in finance, but every new project or challenge in data science is an opportunity to pick up domain knowledge in a new field.”
Through working with large amounts of data, the students were able to gain insights that they could reflect in their dashboards. Vahideh Rasekhi found that “overall, borrowers considered as ‘white’ had a higher chance of receiving a loan. Also, borrowers between ages 25-34 received more loans than people in the other age groups.” As the students performed deeper analyses, they were able to identify weak points in the data and provide recommendations and cautions for future analyses. Chris explains that “the current regulatory disclosure regime under HMDA may not adequately address concerns regarding whether mortgage application processes and decisions are as inclusive and equitable as they could be because of the potential [conscious or unconscious bias or errors] involved with such reporting.”
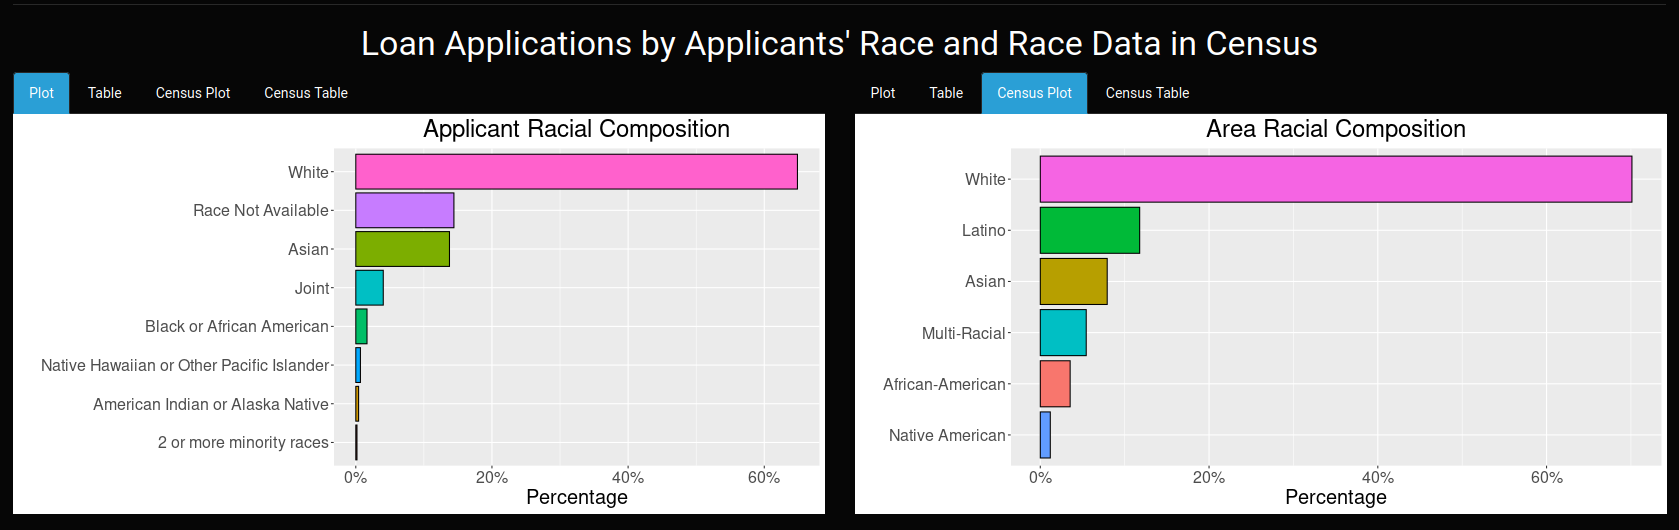 Comparing race composition of residents and those that have applied for a mortgage
In addition to learning how to work with large amounts of data, the students gained more experience working as a team. Rohit was the team lead for his group. “Some of my responsibilities included creating a unified vision between Joshua, Vamsi, and I, setting goals and deadlines for the project, leading stand-up meetings during class, and listening to and supporting team members. Our group had an ambitious vision from the get-go so trying to stay on schedule for a fairly short, two-week project was one challenge we faced.”
The students left the project with a deeper appreciation for data and how it can be used in a business setting. For Vahideh, her favorite part “was working with the data. It was interesting to see how loan applications are approved or denied based on the demographics and regions people live in. Comparing loan approval/denial rates for borrowers from different racial and ethnic backgrounds was very informative.” Rohit had additional insights, saying “this project made me realize that while critical thinking and data analytics are important aspects of being a data scientist, how data is presented to the end user is equally important. It made me ask myself questions like, ‘Is the data presented in [a] way that is intuitive and accessible?’ and ‘Can the main takeaways be easily gleaned by an outsider?’”
We are always appreciative when community members take the time to share their expertise and provide feedback to the students as they learn new skills for their career in data science. Thank you to Hauser Jones & Sas for partnering with Data Science Cohort 5 for this project, and providing this excellent learning opportunity to the students.


