For their final project before capstones, part-time Data Analytics Bootcamp Cohort 5 partnered with the Smile On 60+ program to analyze the data and share their insights. Smile On 60+ is an effort by Interfaith Dental Clinic to provide access to oral healthcare for low income, mobile seniors with the goal of improving overall health. Ben Schuler, a graduate of Cohort 1 of the full-time Data Analytics Bootcamp and a contractor with Interfaith Dental Clinic, presented the project to the class and posed the questions: who has Smile On been serving, what is the impact of the Smile On program, and are there any correlations between procedures given and improved outcomes?
This project presented many challenges to the students, starting with the quality of the data. Data cleaning is an essential step in any data project, and it was a valuable experience for the students to see this in a real-world context. Jose Luis Quezada, who helped coordinate the visualizations used in the presentation, said that “From the beginning, we knew the data gathering tool used by the company to keep up with patient information did not create a record of each individual patient nor the progress of their procedures. With an inadequate system for patient information, we were unclear on how to determine if each patient or clinic was serving as many patients as possible with positive results.”
Cleaning the data laid the foundation for exploring and gaining insights from the data. One of the measures the students studied is how confident a patient felt before and after procedures. Robert LaNier, who was responsible for organizing the slides and scripts for the presentation, noted “One of the most interesting insights revealed was that simple dental procedures were the most successful in making the patient feel more confident.” Based on their analysis and insights, the students were able to provide recommendations to Ben and his team. Robert continued “...there should be more motivation either through incentives or other means for underrepresented demographic groups to take advantage of the Smile On program” and “incentivizing employees for data quality so it would improve data harvesting.”
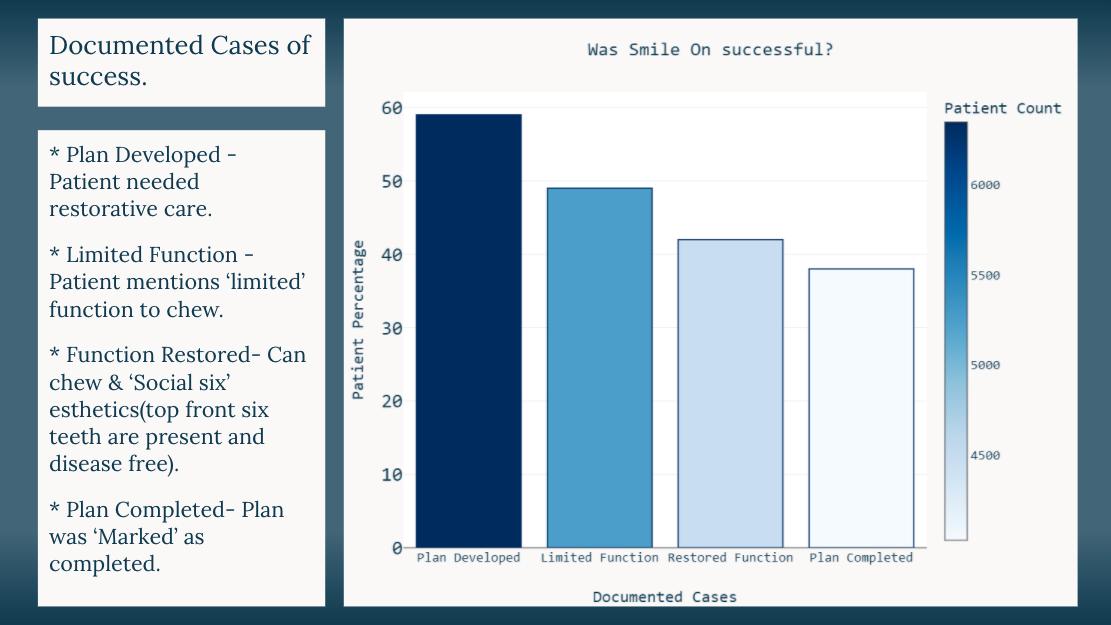
Bar chart showing the different outcomes of patients. The height of the bars show the percentage of patients that fall into a particular category out of the total patient population. The color represents the actual number of patients. While there is still room to grow, with only about 60% of patients having a plan and only 40% completing a plan, there is still a large number of patients that were helped through the program.
The presentation the class put together was a group effort, and coordinating so many individuals is a big task. Jose Luis spoke to this, saying “...collaboration and open communication is a luxury that cannot be taken for granted when working on projects like these remotely. I am thankful the team was able to upload their pieces and post their descriptions for their visuals on short notice.” Robert also experienced this in his contribution to the presentation, saying, “soft skills are very important when collaborating on a very large project…It’s easy to say what not to keep within the slide deck, but it can be challenging making sure the team member still feels included and valued for their contribution.”
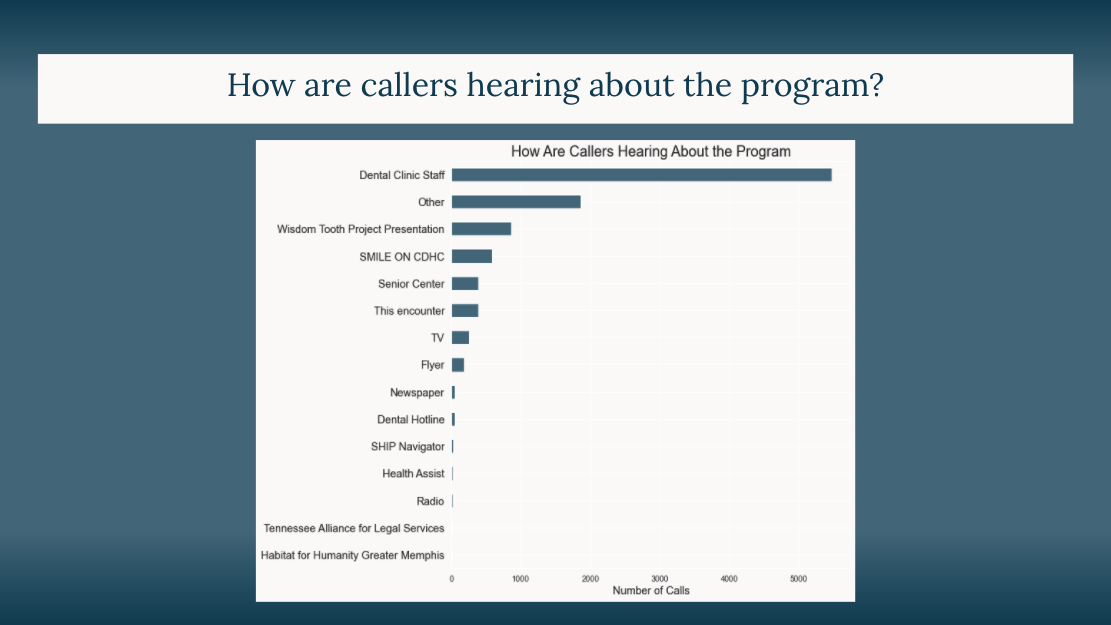
Bar chart showing the different ways patients heard about the Smile On 60+ program. The vast majority heard about the program from the staff themselves, with decreasing numbers hearing from different sources. This is what led the students to the conclusion of increasing efforts to enroll more patients in the program.
These projects, where students have the opportunity to partner with working data analysts in the community, are a critical part of our curriculum and a wonderful chance for students to learn what it is like to work as a data analyst and experience some of the projects happening currently in Nashville. Robert remarked, “My greatest part of the project was knowing that the Smile On program existed. One of the first things I did after learning about the program was to tell family and friends that I knew who would benefit from it.” Jose Luis also noted some important lessons from the project, such as “...our jobs as data analysts will involve cleaning information out of systems that may not be appropriate for collecting large amounts of important information before we even begin to explore the data, and come up with our conclusions.”
Thank you to Ben Schuler and the Smile On 60+ program for partnering with part-time Data Analytics Cohort 5 on this project. You can learn more about the Smile On 60+ program here.
Meet the graduates of both our data analytics cohorts on January 6th during demo day!
RSVP: nashss.com/DAdemoday
Meet the graduates on their class websites.
PT Cohort 5 Website: nashss.com/parttimeda5
FT Cohort 5 Website: nashss.com/fulltimeda5


