Last month the students in Full-time Data Analytics Cohort 4 worked with the Metro Nashville Codes Department to better understand how long it takes to build a building. If you’ve ever tried to add on to your house, built a new house, or seen all the new construction as you drove around Nashville, each of those projects requires a permit issued by the Codes Department. As you can imagine, they deal with a lot of permits! Each permit needs to be evaluated by up to six other departments before it can be issued. In addition to the logistical challenges, this presents a huge data challenge. The Metro Nashville Codes Department presented this data challenge to the students and asked them to share their insights into the permit process to help them better plan their work.
This was the first partner project for the students of Cohort 4. For these projects, community members are invited to present real-world data questions to the students. Not only does this give students insight into what life as a data analyst will be like, but it is an opportunity for students to combine all the technical tools they have learned and practice important collaboration skills. Simon Mack helped keep track of tasks and coordinated work between the groups. “The biggest thing I learned is the importance of setting a foundation of clear communication from the beginning of a project,” he shares. With multiple groups working on individual parts, bringing those parts together was no easy feat. “Of course, another big thing was accepting that you're going to have to compromise on a lot of decisions when you’re working with so many people with varying perspectives -- if you're not willing to do that, you won't be able to move forward to reach the MVP and beyond.”
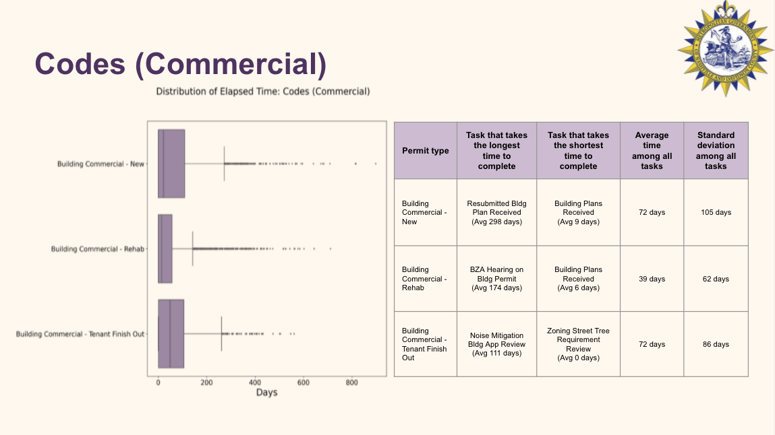
A core deliverable to the Codes Department was how long each department took to complete their tasks. Holliday Therrell and Julien Gerlock, who led the charge on preparing the information for the presentation, found there was a lot of variability in the data and that there wasn’t one best way to visualize it. “Once we started getting the boxplots in the presentation, we realized that while it did show a spread, it didn’t give concrete, actionable insight to the audience,” Holliday and Julien explain. “So we decided to include a table of metrics relating to the tasks with the longest and shortest average time to complete, in addition to including the mean and standard deviation of all tasks in that department.”
The students
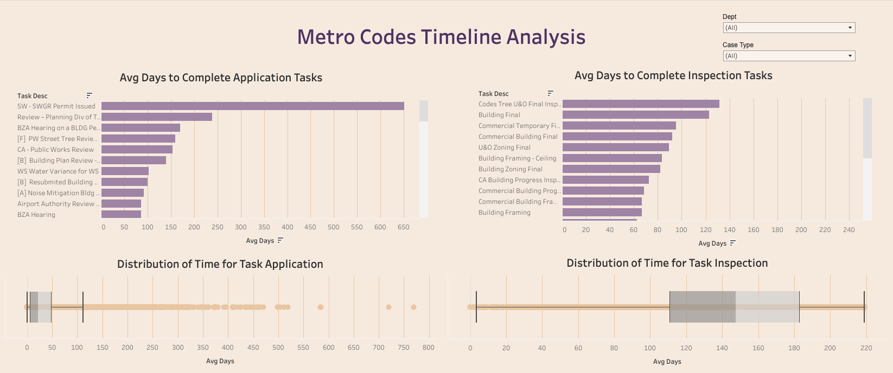
went above and beyond by building out a dashboard the Codes Department could use to gain further insight into the tasks for issuing building permits. Rachel Woeltje and Toni Kim were in charge of putting the dashboard together. Through building a dashboard with a specific business goal in mind they learned “that the foundation of developing a dashboard is to understand and process the data properly.” They also recognized that this was a tool to help the Codes Department make decisions, and so to ensure the dashboard provided relevant decision-making guidance, they found “it's important to properly display the data to understand which areas [of the building permit process] require more time to be completed and to represent the average amount of days [of the total process] for future reference when obtaining permits.”
The students of Full-time Data Analytics Cohort 4 worked hard to deliver an outstanding presentation that addressed the client’s needs, gained valuable experience facilitating communication through daily standups, and deeply explored data to understand it’s structure and uncover insights. You can learn more about all the students in Cohort 4 on their class website.


