Just because summer is winding down doesn’t mean the fun at national parks has to stop. In June our seekers and students from the Analytics + Data Science programs analyzed data from the national parks.
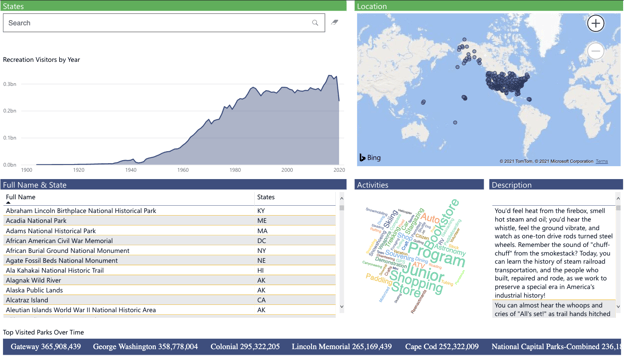
Tim Haymer, a graduate of full-time Data Analytics Cohort 3, was the winner (for the second month in a row) of the June Data Viz Challenge with a great interactive dashboard showing the location, attendance, activities, and more for each National Park (check out the scrolling bar at the bottom!).
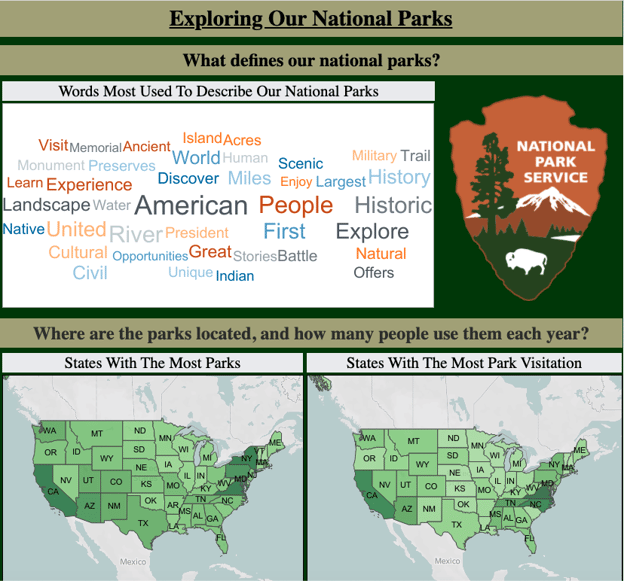
Brenda Gutman, a graduate of part-time Data Analytics Cohort 4, received an honorable mention for her dashboard that featured a word cloud to show the most commonly used words to describe the national parks.