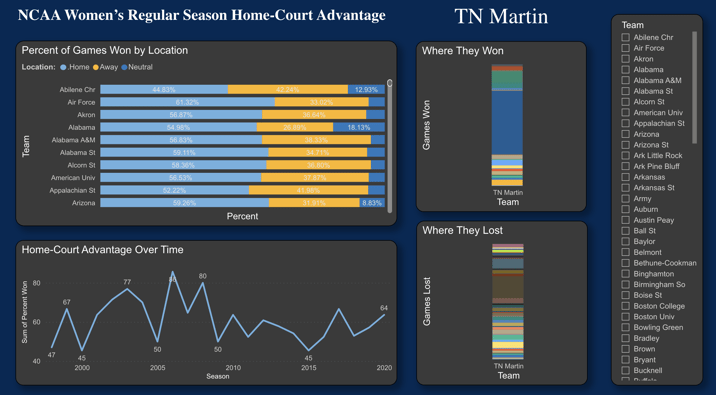
March brings madness -- no, not the I’ve-been-sitting-at-home-for-a-year-now-when-will-it-end madness -- NCAA basketball! Our March Data Viz competition introduced a 19-table relational database with information about regular season and NCAA Tournament games for men and women over the past 20+ years. Our winner, part-time Data Analytics Cohort 4 student Brenda Gutman, created this team explorer tool in Power BI.
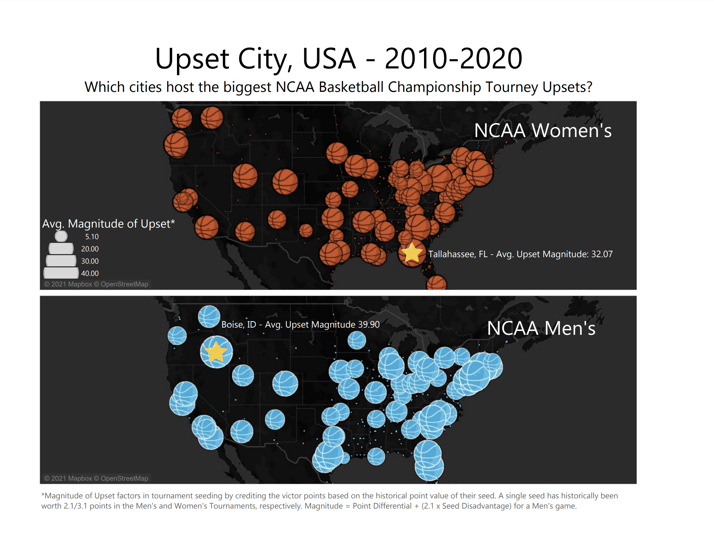
Honorable mention goes to Kyle Yandow, a graduate of part-time Data Analytics Cohort 3, who created this map of the biggest upset cities using Tableau.
For April, students and seekers (graduates looking for their first analytics jobs) will dig into data from Glottolog to explore more than 25,000 languages and dialects from around the world.


