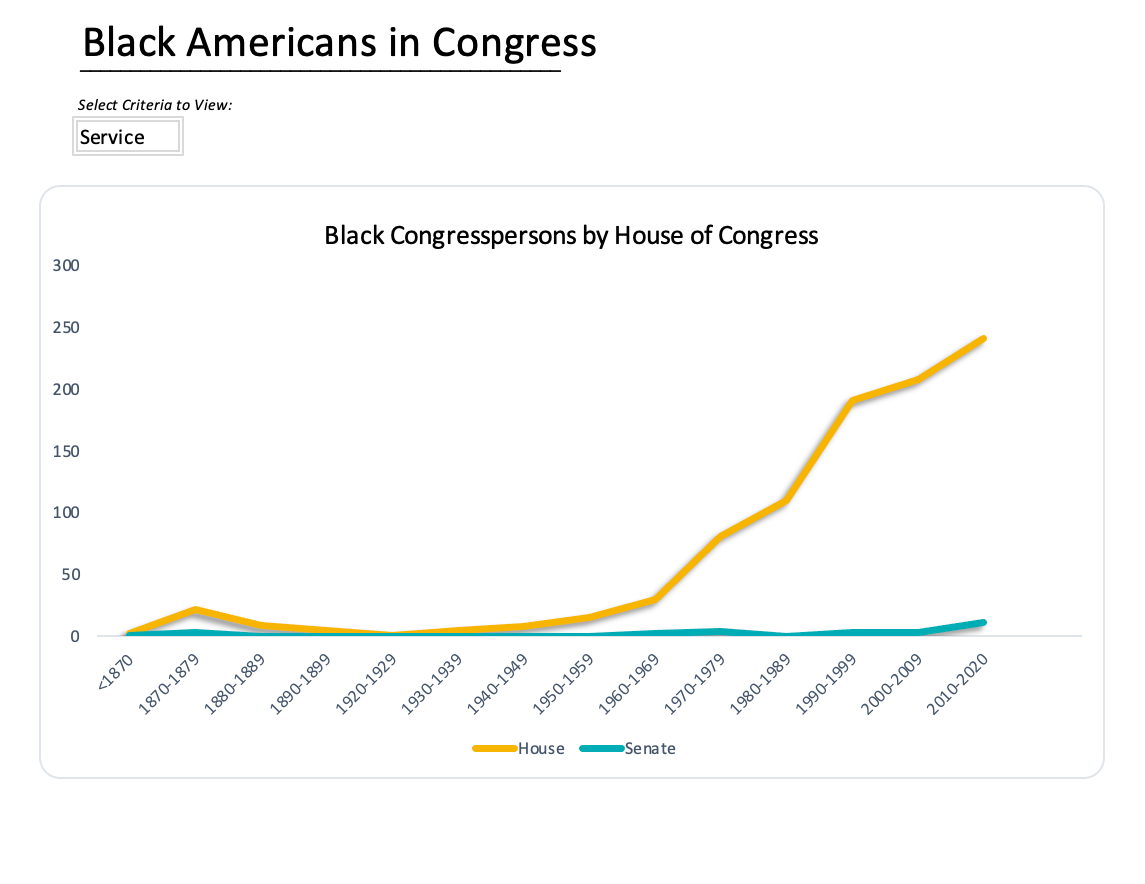
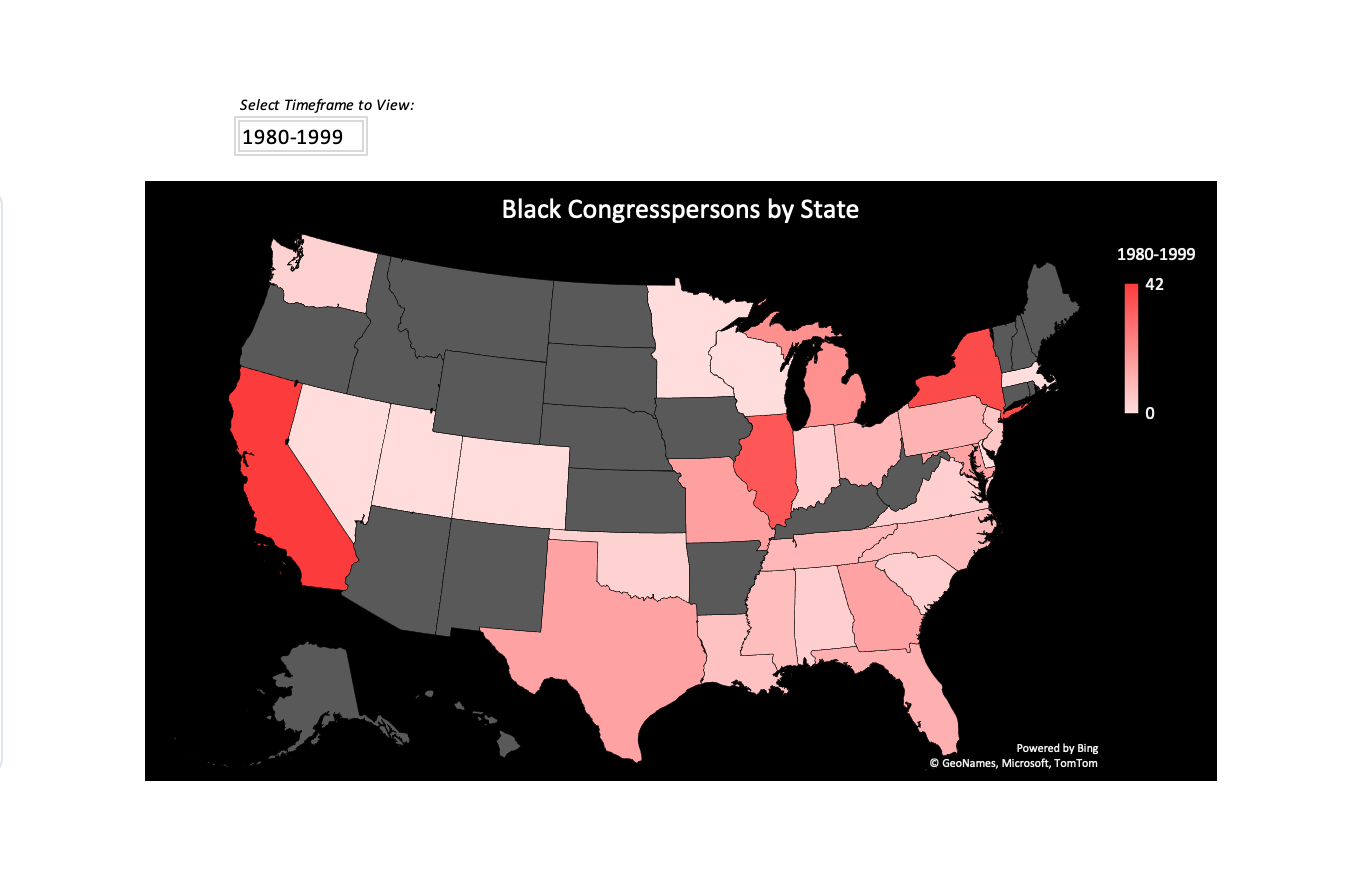
In anticipation of Black History Month, the January data for the NSS Data Viz Competition, was obtained from the House of Representatives history website. This data explores Black Americans in Congress. The winner, Data Science Cohort 3 graduate Anamika Sharma, used the competition to practice a skill she learned after graduation - Tableau. Anamika’s interactive dashboard looks at Black representation in the legislative branch of government by party, state, and legislative body over time beginning with the 42nd Congress (1871 - 1873) through the 116th Congress (2019 - 2021).
Honorable mention goes to Jennifer Whitson, a student in Full-time Data Analytics Cohort 3, who has just reached the halfway point of her bootcamp. Jennifer’s interactive Excel dashboard showed off her new skills and represents the earliest point in learning that a student has entered the competition!


In celebration of the landing of the Perseverance Rover on Mars, in February students will be creating visualizations from Mars and Nashville weather data.


