Last month we launched a data visualization competition for all of our current Analytics + Data Science students and data Seekers -- graduates of Data Science and Data Analytics bootcamps who are still searching for their first job working in analytics. The competition encourages students and Seekers to practice their coding skills, learn more about visualization tools, and work on data storytelling. A new dataset is provided each month for students and Seekers to explore, find the story, and then show it off with a visualization. Submissions are judged by the Analytics + Data Science instructors with a winner each month.
The first competition dataset, in honor of Alex Trebek who died from pancreatic cancer on November 8, featured more than 200,000 questions and answers from the game show Jeopardy!
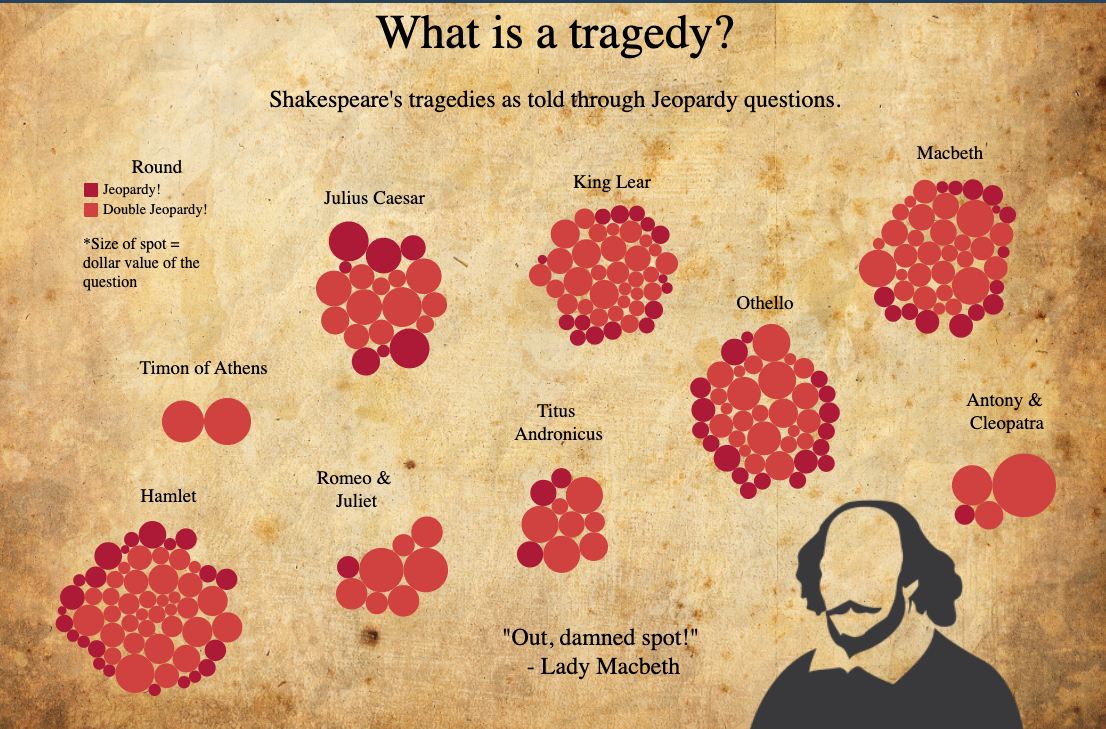
Heather Sopel, a student in Full-time Data Analytics Cohort 2, won with a Tableau dashboard. Heather described her process for deciding on the story to tell, “I looked at the categories using Python and had a couple of ideas, but then focused on the Shakespeare questions.” There were so many questions related to Shakespeare that she ended up narrowing her selection even more to only include tragedies. You may not be surprised to learn that Heather has a degree in Theater Arts and extensive experience in stage management.
An Honorable Mention goes to Savannah Sew-Hee, a student in Data Science Cohort 4 for her exploration of geography questions in the dataset using Plotly Dash and deployed on Heroku.
December’s dataset focuses on worldwide crop yield. We can’t wait to see what stories they find.


