This series features mid-course projects for our Data Science Bootcamp. Students were tasked with asking an interesting data question and finding a dataset to answer the question. Next, they spent time cleaning, wrangling, and exploring the data, before designing and building an interactive Shiny app.
Data science has given sports teams, and their fans, new ways to analyze their performance and make better decisions for the future success of the team. For his midcourse project, Cohort 3 Data Science Bootcamp student Dibran Rexhepi dug into the data and delivered valuable insights on La Liga (Spanish soccer) league.
Soccer has been an important part of Dibran’s life, both as a game he’s coached and played. With nearly 50 years of data on La Liga at his fingertips, he set out to discover “if there is a pattern in the teams that win the league each year.”
The length of a La Liga season is 38 matches and there are 20 teams in the league.
As he explained in his project proposal, there’s a trend for professional leagues worldwide: “Out of the 20 teams in each league, there are always five or six teams that are always on top of the table and usually one out of those…teams wins the league each year. I want to find out if there are factors that keep these teams at the top.”
THE DATA QUESTION
In exploring the patterns of team performance, Dilbran was specifically interested in answering the following question: How does the addition of new players affect the win percentage of a team?
To reach answers, he used a team-level dataset from Kaggle.com, which had information on games played in the last five decades by teams in La Liga. He also scraped player data from sofifa.com using the following Python libraries: Beautiful Soup, Pandas, NumPy, and urllib.request.
CLEANING THE DATA
Prior to cleaning the data, Dilbran worked through challenges in scraping data from more than 300 pages on the SoFIFA website. In doing so, he learned to automate the scraping process from one page to the next. Once the data was compiled in a CSV file, he used the R Tidyverse package for clean-up prior to merging.
Describing the cleaning phase, he said he had to “convert Euros into US Dollars and then turn them into integer values by removing the (dollar) signs, commas etc. I had to correct the team spelling to make them similar so they can merge.”
VISUALIZING THE DATA
Explore Dibran’s Shiny app LaLiga Soccer Data.
Dibran’s Shiny app gives users a deep dive into the performance of La Liga teams. The introductory section offers helpful guidance on each of the app’s sections: League Table, Overview, Rating, and New Players.
He used ggplot2, plotly, ggpubr, highcharter, gt, and d3tree to create a variety of interactive visualizations, including clustered column charts and tree maps. The user can toggle between teams and years to see team performance through time. Also available is a detailed view of player ratings and characteristics.
Of his visualizations, Dibran said, “They were the best choice for providing the most information and, at the same time, make it easy to read and interpret. My goal with these visualizations was to allow the user to explore and investigate team performance and find factors that affected team wins.”
THE RESULTS
Dibran’s findings confirmed his initial observation at the start of this project: The few teams that win tend to stay on top. Over a 47-year time span, he said, “Only seven teams have won the league, and, out of the seven teams, Real Madrid won 21 times and Barcelona won 17 times. Truly a two-horse race when realizing that there are 20 total teams that compete each year.”
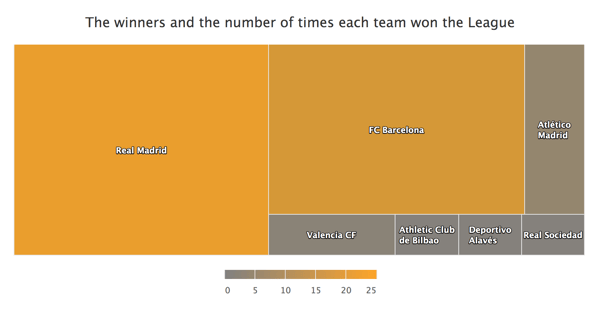 This tree map shows the prominence of Real Madrid and Barcelona in terms of the number of league wins.
Dibran was surprised to find that bringing on new players does not, on average, affect a team’s win percentage. He surmised that adding new players could lead to team imbalance. “This can affect the dynamics and chemistry of a team, which can lower the performance.”
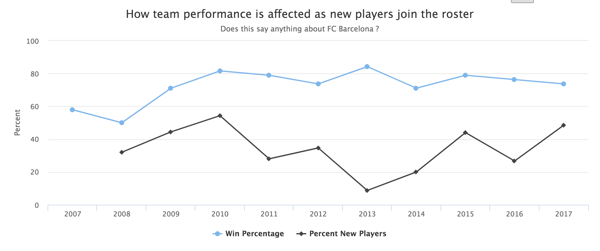
This line chart tracks win percentage and the percentage of new players for Barcelona from 2001 to 2017.)
While he focused on the addition of new players for a team in a given year, he’d like to take a more detailed view of new player activity going forward. “In future directions I want to narrow it down and find new players that teams signed who are actually starters. More often than not teams buy players as reserve and don't end up playing as much, and thus should not affect win percentage.”


