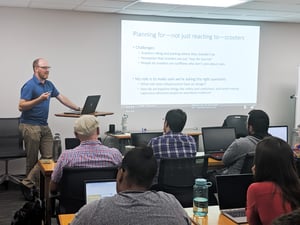
 I have yet to meet anyone who doesn’t have an opinion about scooters in Nashville. So when Peter Bird, Active Transportation Planner for the Metropolitan Nashville Government, refers to himself as one of the most polarizing figures in city government it is clear that he is only half joking. Peter Bird visited Data Analytics Cohort 1 last month to frame the analysis question for the class’s first team Python project. In planning for active transportation (walking, bikes, scooters) in the metropolitan area, the primary goal according to Transportation Planner Bird, is for safer and more efficient streets that are designed for people.
Turmoil and debate have characterized the city’s work to regulate scooters here, and Metro Nashville Government is currently putting together a Request for Proposals (RFP) that would allow up to three companies to operate scooters in Nashville. The goal is to have contracts signed by next month.
One of the specific questions the class worked to answer is what is the ideal scooter density that would “serve transportation goals,” and also “mitigate scooters piling up on sidewalks.” The baseline goal for scooter use is 3 rides per scooter per day, with a ride defined as 10 meters or more. The original pilot limited scooter density to 340 scooters per square mile.
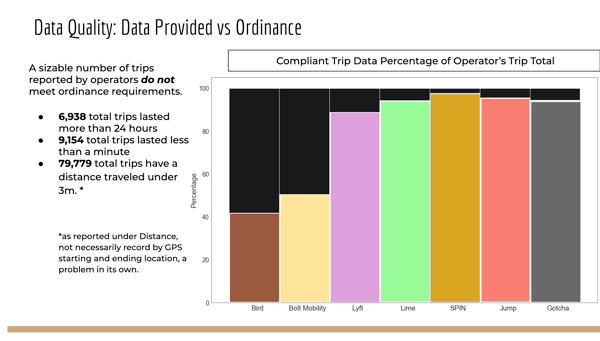
Students also looked at data quality issues to evaluate which operators were most in compliance with an ordinance that went into effect on August 29, 2018. (NOTE: The city’s legal term for the scooters is Shared Urban Mobility Devices or SUMDs.) Operators are required to clean data before sharing it with city government to remove staff servicing and test trips, trips that last less than one minute and trips that last longer than 24 hours.
There is added interest in providing a “last mile” transportation option for those who rely on public transportation in the city’s Promise Zone. The Promise Zone made up of 6 subzones, contains communities that have higher poverty rates.
Two types of datasets were provided for the months of May, June, and July 2019. The scooter availability data consisting of results of polling for location at 5-minute intervals for each scooter not in use. These were large datasets with between 20 and 30 million rows for each month. The second dataset, trip data, showed the start and stop times and locations, trip lengths and trip durations. These were smaller datasets ranging in size from about 225,000 rows for May to less than 135,000 for July.
Student Findings
Some operators provided trip data that was out of compliance
Just over 30 percent of the trip data was out of compliance with the ordinance. As shown below, students found that some operators (notably Bird and Bolt) contributed data that had a greater proportion of non-compliant data.
More scooter trips occurred on weekends for all three months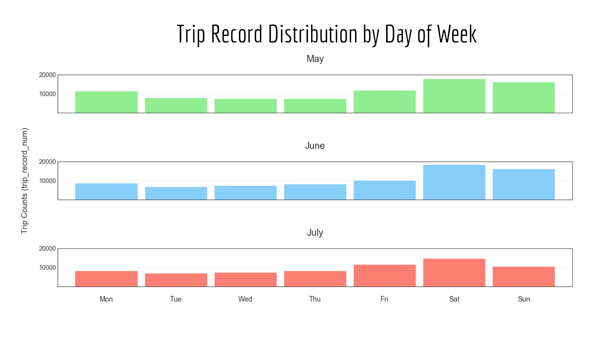
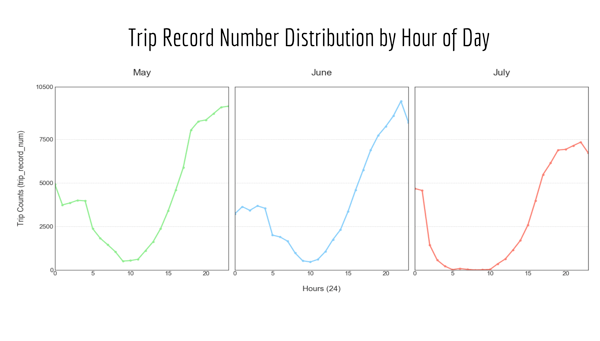
More trips occur in the evenings
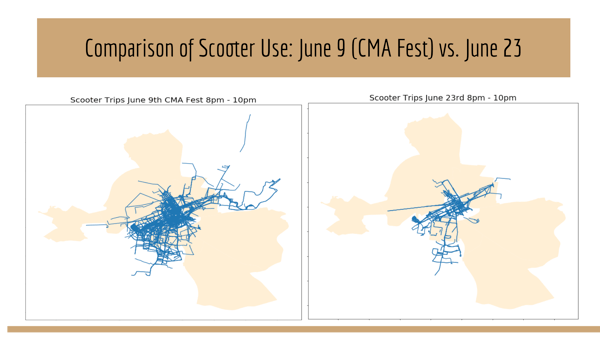
 Scooters tend to be used more during events
Students compared scooter use between 8 and 10 pm for Cinco de Mayo (compared to May 12 use), Independence Day (compared to July 11 use), and CMA Fest on June 9 (compared to June 23). The difference in trip data was most notable for CMA Fest, as shown below.
 Scooters are underutilized in the Promise Zone
In the six Promise Zone subzones, scooter availability, trips, and idle times (time between uses) vary greatly. This interactive map shows more use in subzones 1, 2, and 5.
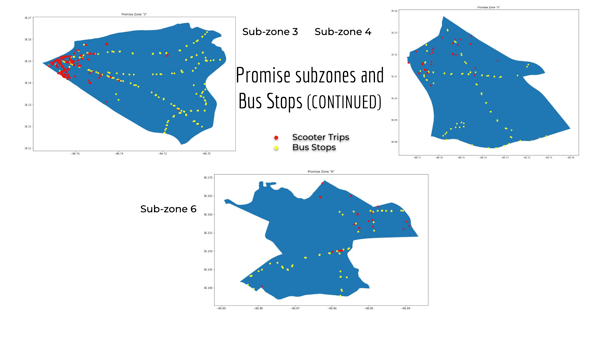
A closer look at scooter trips (start location is plotted in the figure below) and bus stop locations for Promise subzones 3, 4, and 6 showed little relationship between the two suggesting that scooters aren’t being used as hoped to complete commutes.
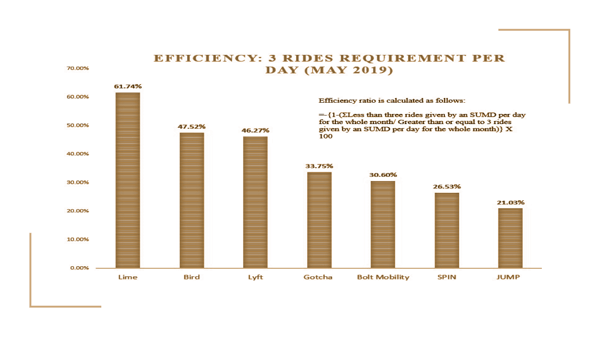
 Some operators are more likely to have scooters that meet the three rides daily minimum
Another finding was that some operators tend to be more popular with users, or at least more likely to meet the minimum three rides per scooter per day baseline set by Metro.
 Optimal Density
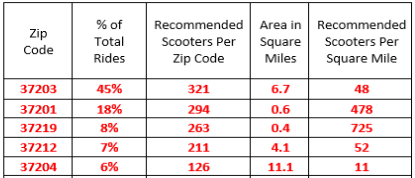
Students created a formula that recommended scooter density by zip code for all of Nashville, taking into account the share of total rides that occurred in that zip code, the number of scooters needed to support usage (as reflected in the data at hand), and the number of scooters needed given a baseline of three rides per day. Because scooter use fluctuates, they also recommended that scooters be “rebalanced” or moved to the original allocation location every few weeks. The table below shows recommended density based on use patterns for the five zip codes where most trips occurred for the three months reviewed. Additional allocation and incentives to promote use in the Promise Zone is a more complex issue, and was not part of the class analysis.
"The work of Nashville Software School’s Data Analytics students evaluating historic data from e-scooter companies operating in Nashville comes at a very important time," shared Peter Bird. "As the city is currently re-evaluation the program, this analysis will be a valuable tool in understanding with a fine grain of detail what has been happening on the ground." You can view the students' complete findings here.


