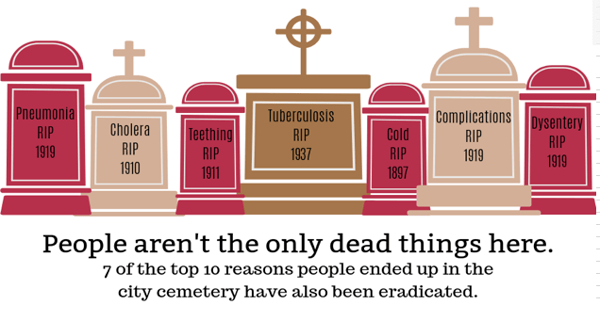
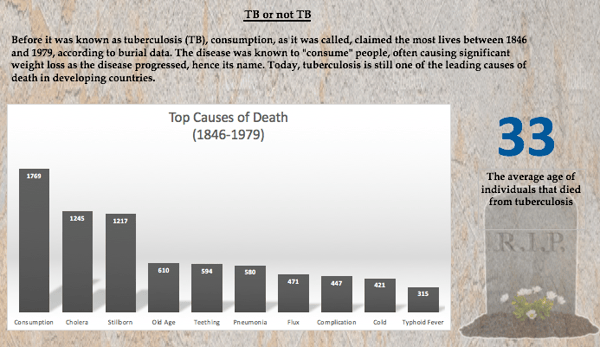
The first Data Analytics cohort wrapped up their study of Excel this month. Sandwiched in between a project working with an untidy Internal Revenue Service dataset to target areas for tax relief and another using PowerPivot to load data from AWS was one to explore and create charts. Students were instructed to create charts along with text that could be used on a website or in printed materials to create interest in the Nashville City Cemetery.
The city cemetery data is available on Nashville’s Open Data Portal and contains much more than factual information about the people interred there. This rich dataset offered a glimpse at historical trends in medicine, literacy, racial equality, and more. Students seemed to enjoy tapping into their creative sides to develop cemetery marketing materials. Here are a few of the charts they created.


Now students are learning to use Python and Jupyter Notebooks to create reproducible analytics workflows. After a warmup project to examine the relationship between Gross Domestic Product (GDP) and Internet Usage for 278 countries over 45 years, the class will begin a project in collaboration with Nashville government transportation planners to look at scooter availability in Nashville.


