“Debugging is twice as hard as writing the code in the first place.” --Brian Kernighan
 Writing software is hard. Debugging software is harder. It comes as a surprise to some students to learn that software developers spend much more time reading, understanding and debugging code than they do writing it. The expectation is usually the opposite. Maybe it’s the words we choose to describe the work? Software development. Programming. Coding. These words suggest an active process of creating and, to the uninitiated, that implies putting fingers to keys and churning out code. Mastering the skill of debugging is essential, though. There’s no avoiding it. My advice is to jump right in.
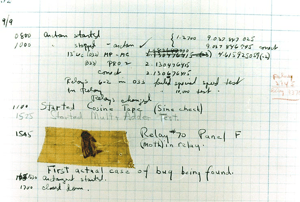
Learn the origin of the term software bug.
Why Debugging Is Hard
But why is debugging so much harder than writing code? Well, when we’re building something new - assuming we’re going about it in a reasonably sane way - we only have to think about a small piece of the whole application. What does this function need to do? What is the appropriate API for this class? We build a mental map with a “you are here” arrow pointing directly at the code we’re writing. We have a pretty solid idea of the immediate landscape around us (what calls our code and what our code calls), but as we move outward, our map becomes more vague and less precise.
Debugging, however, requires a broader view. The effect of the bug is seen in one place, but that doesn’t imply that the cause is in the same place. We start our search at the point where the bug shows itself, but from there we must move outward. We work backwards, walking the various paths through the code to see how we got here. Our mental map needs a lot of detail in a wide area. Keeping all that detail in mind increases cognitive load. Debugging is harder simply because we have to keep more information in our head at once.
Debugging Tools
Fortunately, we have some tools to help us with this tough task. These tools take the form of both technology and technique. On the technology side, the simplest, oldest - and still often the best - is print statements. “Printline debugging” is the approach of writing out little messages to yourself to help determine what the software is doing. These messages are the landmarks we follow to find our way. Because of its simplicity, this is the tool most students reach for when tracking down a bug.
Another technical tool is the generically named “debugger”. This tool let us interactively follow the code line-by-line as it runs. We can inspect the values of variables and watch as they change. The debugger is a bit like the self-driving car of our code world. It lets us offload much of the effort of holding a mental map in our heads. Students can be intimidated by the debugger and all to often tend to avoid using it. This can turn what would be an easily solved problem into hours and hours of frustration. My advice: use the debugger.
There are other technical tools as well. Web browsers have a built in set of “developer tools” that every client-side developer should explore and understand. Databases have profilers and query analyzers. Operating systems have simple process and network monitoring tools, and there are many more robust options that are a simple download and install away. At a very high level, each of these tools has one, common purpose: to give us a clearer picture of the running software system, to help us construct and maintain our mental map.
The Debugging Process
The goal of debugging is, unsurprisingly, to find and correct a bug in a piece of software. As I suggested above, most of the time it’s the finding part of the process that takes the majority of the time. Thus, when it comes to debugging technique, our goal is to reduce the amount of time it takes to track down the bug. In order to speed up the process, it’s important to be systematic and methodical.
The first step is gathering information. Is there an error message? What does it tell us? Is there a stacktrace? Does it point to a particular line of code? If there isn’t an error message, where does the incorrect behavior manifest itself? This first step focuses on understanding the effect of the bug, the external signs that our code isn’t quite right.
The next step is to determine where the bug isn’t. What parts of the code can we be reasonably certain aren’t related to the bug? This step can be trickier than it may seem. Students tend to start by cutting away too much of their mental map and focusing only on the part of the code immediately surrounding the place where the bug’s effect is seen. This is understandable, of course, the student is - perhaps consciously, perhaps not - attempting to reduce the search area. They are trying to lower their cognitive load. Unfortunately, this often means the bug is hiding away in an unsearched corner of the code. As a rule, if it’s at all possible for a bug to be in some part of the codebase, don’t forget about that part.
After we’ve determined where the bug can’t be, it’s time to focus on the places it could be. Starting with the effect of the bug, we work our way backwards. If there’s an exception in a function, what does that function do? Who calls the function? What are the values of the arguments passed to the function? Who called the calling function? Who called that? ...and so on... This is the step where we pull out our technology. A debugger, for example, can be a tremendously valuable tool to help trace through the code. The goal of this step is to find some part of the code we suspect might be faulty.
Read that last line again. I didn’t say the goal is to find the bug. The goal is actually to form a hypothesis about where the bug might be. That leads us to the next step: test the hypothesis. We do this by making a change to the code. This change may be in the form of an attempted bug fix, but it may not be. The goal here is not to fix the bug, but to determine if we’ve found the bug. An example of a code change that isn’t a fix is hard-coding the value of a variable instead of getting it from the user. That lets us ask the question, do some values cause an error, while others don’t
After we test our hypothesis, we can ask ourselves a question. Did we find the bug? If so, great, now we can go about fixing it and testing that fix. If not, well that’s ok, we have learned more about our system and we can return to the search again with a better understanding of our software and of the problem we’re trying to solve.
Debugging Is Essential
Debugging code is not the same as writing code. It’s not exactly a creative process, at least not in the same way as writing code is, but it is essential to being a software developer and becoming good at it will make you better at writing software. It’s also hard. It can be really, really hard. But that’s why we got into software development in the first place, isn’t it? To do hard things. To solve problems. To stretch ourselves and overcome challenges.
Thanks to Mary van Valkenburg, NSS Data Science & Analytics Program Manager (and my wonderful wife), and David Taylor, recent NSS graduate, for their help in editing this post.


