Kaggle creates a community to promote learning from others and provides a platform for practicing machine learning. Students in Data Science Cohort 2 recently competed in an Earthquake Prediction competition on Kaggle sponsored by Los Alamos National Laboratory.
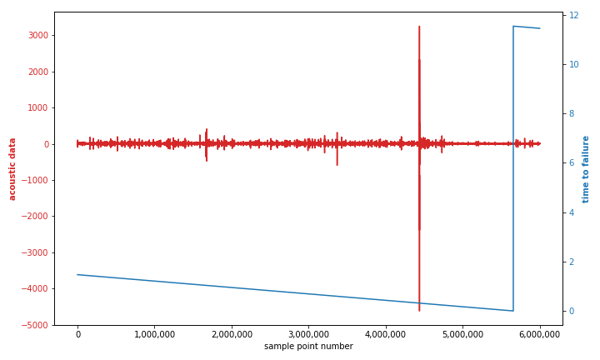
The training data from lab-generated seismic activity consisted of just two variables: acoustic data (the lone predictor variable) and the time to failure (the target variable). Training data was a single continuous segment of earthquake simulation consisting of over 600 million observations.

Given the pattern of acoustic data (red), how do you predict the time to failure (blue), where zero means an earthquake?
This problem required engineering new features, ones that would be predictive of the time to failure in new segments. Student teams created various statistical measures over rolling windows of different sizes. They tried simple linear regression, random forest regression, and gradient boosting algorithms like LightGBM and CatBoost, with each team gradually reducing the mean absolute error between their predictions and the actual values in Kaggle’s hold-out test data.
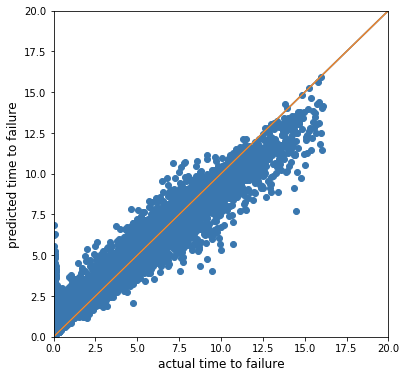
 This is a plot of predicted time to failure vs. actual time to failure (sometimes called an r-squared plot) or assessing model fit.
Final standing had two teams in the top 500 against a field of more than 1600 teams!
| Position | Team | Score (MAE) |
| 341 | NSS-Cardinals | 1.473 |
| 429 | nss-doves | 1.494 |
| 665 | NSS_Swans | 1.520 |
| 882 | NSS-Starlings | 1.553 |
| 1017 | nss-ravens | 1.601 |
| 1225 | NSS-Mighty_Ducks | 1.772 |
| 1332 | NSS_Robins | 1.881 |


