One of the best things about the Data Science bootcamp at NSS is the opportunity for students to practice skills while answering real-world questions posed by people who know the domain area well. In October, students explored Nashville building permit data and property assessment data along with zip code-level tax return data to understand how the supply and demand of affordable housing has been changing since 2009.
 Metro Codes PIO Sean Braisted and Council Member Burkley Allen (District 18) helped define terms like affordable housing and workforce housing, and helped refine the analysis questions: 1) how have available units changed over time, 2) how does the process of demolishing and rebuilding homes affect the availability of affordable housing, 3) do zoning changes play a role, and 4) what does the shortage of available housing look like now and how will it look in 2025.
Affordable housing is housing that costs less than 30% of household income when that household earns 60% or less of the Area Median Income (AMI) and workforce housing is housing that costs less than 30% of household income for people earning between 60 and 120% of AMI. For 2017, the Nashville Area Median Income was $68,000.
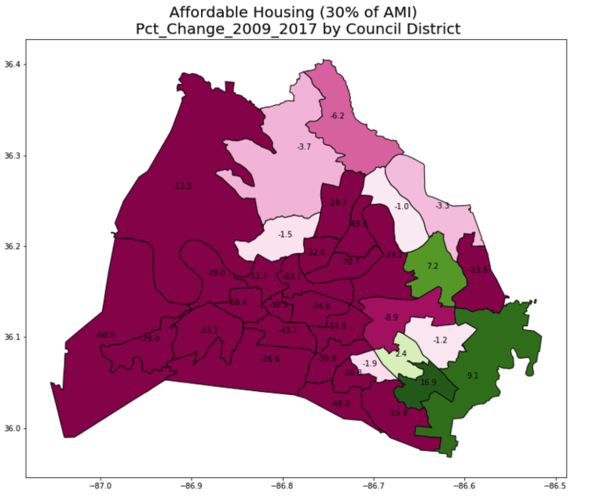
Teams quantified changes in supply and demand – estimating demand according to reported Adjusted Gross Income (AGI) for Nashville zip codes and supply according to property assessments for homes in the same zip codes. Other teams looked at the impact at the council district level (only Districts 14, 28, 32, and 33 have seen an increase in affordable units), zoning trends, changes in the size of new homes, and the impact of homes being demolished and rebuilt as areas of the city become more desirable to wealthier segments of the population.
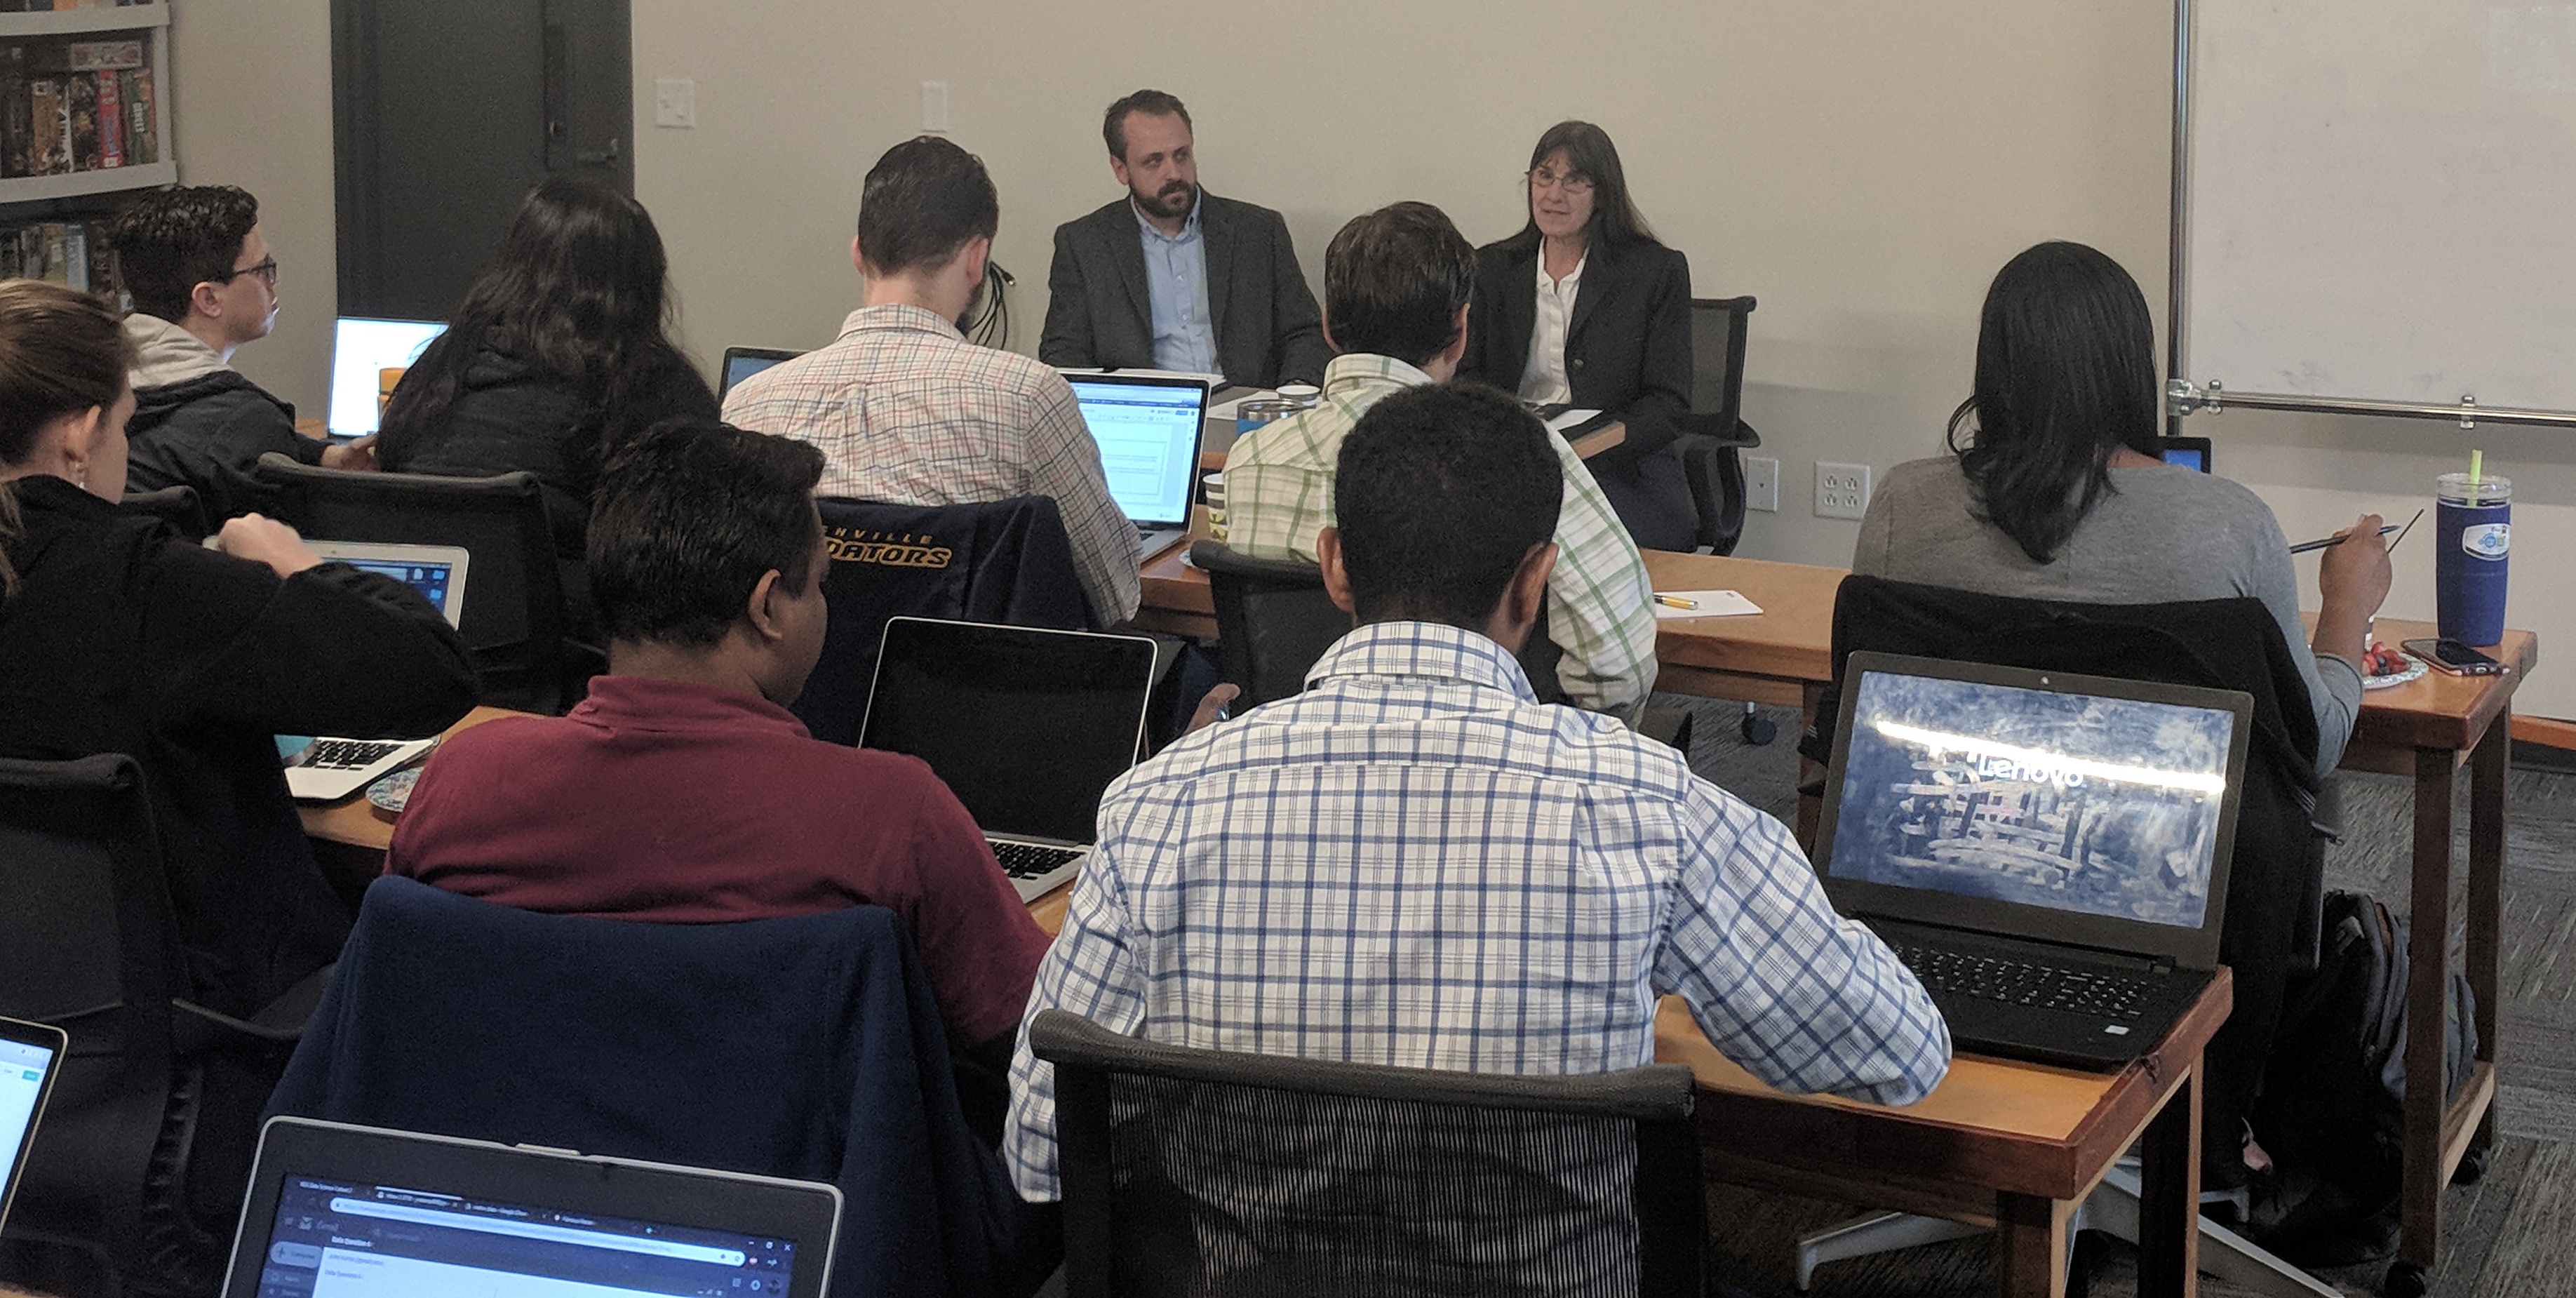
Students presented their analyses and conclusions to Braisted and Allen on October 30. They included findings that wage increases are not keeping pace with home prices (particularly for low income households) and affordable housing is moving from the urban core to the outskirts of the metro area. Complexities around unknown variables (what are the characteristics of people moving to Nashville, for example) and uncertain economic factors make 2025 predictions difficult. One team’s model included ipywidgets that could be toggled to different values to look at different scenarios.
Here are some of their findings:
Affordable Housing: Percentage Change by Council District
Affordable housing declined in almost every council district from 2009 to 2017.
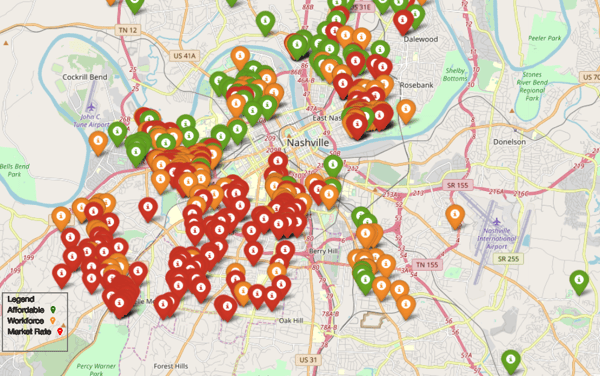
Impact of Homes Being Demolished and Rebuilt
More than half the homes being demolished and rebuilt are sold at market rate.
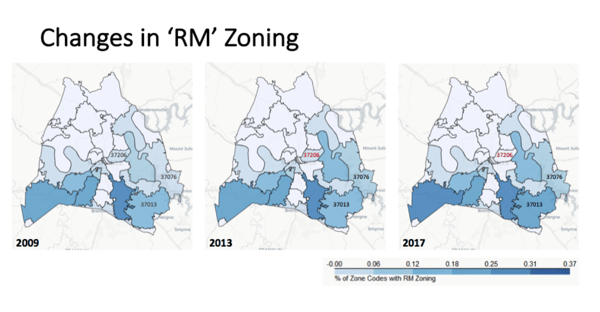
Zoning for Multiple-family Residences (RM Zoning)
Zoning for multiple-family homes has further shifted to the southern edge of Davidson County.


