 April has been a busy month for the first Data Science cohort. On April 7, NSS alum and graph database enthusiast Blaise Gratton introduced the class to Neo4j, a graph database management system, and the cypher query language. This workshop prepared teams to begin exploring a variety of graph databases, including one from NASA. Modeling data as a graph is frequently useful in understanding social networks, detecting fraud, finding routes, and performing network impact analysis among other things. Relationships that might not be apparent in a hierarchical structure can often be detected when modeled as a graph.
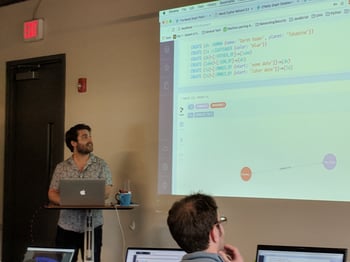
On April 17, John Berryman, a search engineer at Eventbrite and founder of Penny University, shared a talk he gave earlier at the PyTennessee conference. Building on principals in the opening chapters of Aurelion Geron’s Hands-On Machine Learning with Scikit-Learn and TensorFlow, John walked the class through data preparation, fitting models, and assessing their performance with the popular python machine learning toolkit. In his demonstration, John used the Titanic dataset from Kaggle and trained logistic regression and decision tree models to predict who would survive the Titanic disaster. It set the stage nicely for the start of our formal study of machine learning.
On April 19, Zach Gemignani, cofounder of Juice Analytics, shared the wisdom of his more than 10-year focus on data visualization and storytelling. At Juice, Zach’s team focuses on facilitating the creation of useful data products for companies who want to discover the stories their data can tell. One of the sample apps he shared presented a visually compelling and intuitive way to understand the employee makeup of each facility in a hospital network. The app includes a collaborative feature which allows users to share and comment on insights as they uncover them.
We kicked off another data question on 4/21. Using data from BigG Express, students will work to detect unexpected drops in fuel tank levels that may indicate fuel theft. Sensor data that transmits fuel levels in the company’s trucks every 15 minutes will be combined with other information to create methods for detecting unexpected drops in a truck’s 200-gallon fuel tanks.
Thank you to all of our guests this month for sharing your knowledge and BigG Express for sharing your real-world data.


