This series features mid-course projects for our inaugural Data Science Bootcamp. Students were tasked with asking an interesting data question, finding a dataset to answer the data question, cleaning, wrangling, and exploring the data, then designing and building an interactive Shiny app.
Justin Rothbart has fond memories of his excited anticipation as the release date for a new video game approached. Video games allow him to connect to his youth, with some of his favorite games and series originating in the late 90’s. He wanted to see if his view of video games from the late 90’s being the best matched the views of other video game fans.
The Data Question
Justin set out to answer the following questions:
- Have video game review scores decreased over time?
- Are certain video game series immune to decreasing scores?
- When was the golden age for video games?
He shared his original hypothesis:
“I hypothesize that video game scores are less varied by year than they are by system, with the
Super Nintendo Entertainment System and Nintendo 64 having the highest scores. I also believe that video game series like Zelda, Pokémon, and Mario are immune to receiving lower than average scores, through a combination of high resources and reviewer bias.”
Justin found a dataset on Kaggle.com that includes scores and release data for video games released between 1996-2016. The scores are from IGN, a video game website that allows users to rate games and has some simple rating standards in place. He also found a dataset with video game sales numbers.
While the datasets were clean, Justin did need to subset the data into smaller data frames for each video game series. He shared, “I used the stringi package to clean up the text and make sure that everything was ASCII. The reshape2 package allowed me to change the shape of the data frame based on my needs: wide for general table use and long for my time series charts.” He went through the smaller data frames to remove mis-categorized games and games that didn’t include a critic score, user score, and sales data.
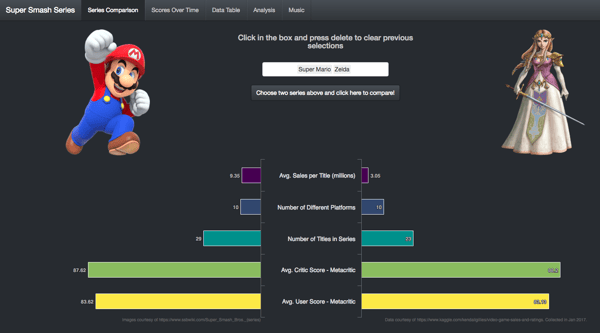 When creating his application, Super Smash Series, to explore the data, Justin wanted to start with high level results and allow the user to go deeper as they explored. To help with this, he created several tabs showing different data points. The first tab, Series Comparison, displays a simple bar chart of 5 summary statistics to compare two video game series. The next tab, Scores Chart, uses a time series chart to look at performance over time for a video game series. He included a bar chart to show sales during the same time period. For users who want to go even deeper into the data, there is a Data Table tab that shows the results for each release in the video game series.
In his exploratory analysis, he used ggplot2, but he wanted more control over each component in his graph so he switched to highcharter, an R wrapper for the JavaScript highchart package. This gave him the ability to change color, space, and labels in his graphs for maximum impact.
The Results
Justin shared a few things he learned.
“My original hypothesis was completely wrong! I thought that critic scores would impact sales, but it's hard to see any correlation between the two when you look at all the data.
Critics and users cannot agree on the Pokemon series. The critic score averages around 65%, while the average user score is a 75%. This differential hardly impacted the sales of Pokemon games - they still averaged 5.25 million units sold per title, second only to Mario himself (9.35 million)!”
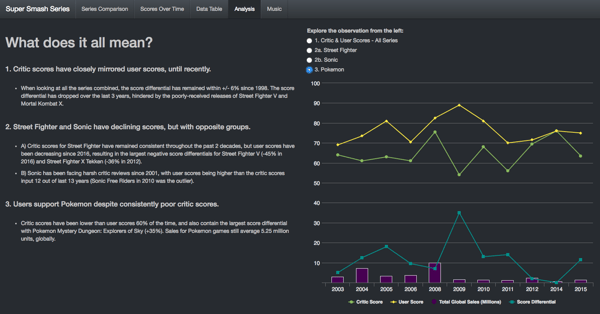 So when was the golden age of video games? As it turns out, the late 90’s was not the golden age of video games. In fact, review scores and sales have stayed consistent across platforms from 1996-2016. Nostalgia did not impact the user reviews as much as Justin expected.
You can explore Justin’s data in his app, Super Smash Series, and see more analysis.


