This series features mid-course projects for our inaugural Data Science Bootcamp. Students were tasked with asking an interesting data question, finding a dataset to answer the data question, cleaning, wrangling, and exploring the data, then designing and building an interactive Shiny app.
The Olympic Games bring excitement to world competition. Athletes from nations around the world gather together to celebrate achievement and to push the human body to do things never thought possible before. While the Olympic Games are so much more than medals, the medals can tell us a lot about the history of the Games.
Inspired by the recent Winter Olympics in South Korea, Brandon Sanders created a Shiny app, Exploring Summer Olympic Data, 1896 - 2008, to navigate data collected for the last 112 years of Olympic events.
The Data Question
Brandon set out to answer two questions:
- Which country has been most successful in the history of the Olympic Games?
- How has success transferred from one country to another over time and across disciplines?
Brandon was surprised at how hard it was to find good data about the Olympic Games. He eventually found data on all Summer Olympic medalists from the 1896 Games of the Olympiad through the 2008 games in Beijing that was compiled by The Guardian. This data came with interesting challenges such as countries who have had name changes in the past 100 years, ensuring that team sports, like basketball, are measured as one win and not counting every athlete on the team, and finding a way to display the large volume of data. The dataset Brandon used included the Olympic year, location, sport (Aquatics), discipline (Swimming), event (1500m relay), medal (Gold), medalists (each solo or team athlete), and gender. The data also listed each country by its three-character National Olympic Committee (NOC) country code. He was able to find data to convert the NOC country code into country names. Merging these two datasets gave Brandon all the data he needed to move forward.
To address the issue of counting team sports medals once, he aggregated the data to reflect total country results without counting each member of a team or relay, but also ensuring that both the men and women medalists of the same event were counted separately. He did a lot of fact-checking to ensure his aggregate totals for events, countries, and genders were correct.
He also considered combining results for countries that have undergone name changes, such as the Soviet Union and Russia or Germany, East Germany, and West Germany. “Eventually,” he explained, “I realized it was more important to preserve the historical significance and give credit to countries as they existed during the Games.”
Brandon walked through his process to clean the data. He shared, “I relied on the readxl package to import Excel files for the Olympic Athletes and the NOC country code crosswalk. Most of all I used dplyr, which includes the magrittr package, to create several pipelines for the data with filter, group by, mutate, and others. It allowed for the data to react to inputs from the user and prepare the data for presentation.”
For his visualizations, Brandon used the pre-built color palettes in the shinythemes package and used ggthemes to tie in the Medals-by-Sport chart to the rest of the page. He chose to use the ggplot2 package to create bar charts as they best represented the categorical data. While he appreciated the ease of applying a standard theme, it still required a lot of time to apply HTML code to ensure the table text, table navigation, button text, and status beneath the table were readable. He also included options to drag and drop columns to give the user more interaction with the data. Users can also show and hide columns, copy, print, or download the data. These buttons were a part of the dataTables package.
The Results
Brandon found several interesting things while exploring the data. He shared them below.
While exploring the data within the shiny app, I noticed Ice Hockey was included as a sport in 1920 - and only 1920. This seemed a bit odd considering the data is supposed to reflect the Summer Olympic games. After some research, I learned that Ice Hockey was introduced to the Olympic Games in 1920, but Winter Olympic Games weren’t held until 1924. Ice Hockey was one of five sports used to start the Winter Olympics.
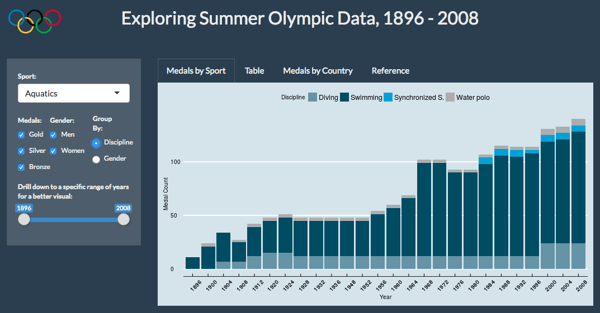
Exploring the data further, I focused on the sport Aquatics, which had a consistent increase in the number of medals awarded over time. Showing the gender distribution in the Medals-by-Sport chart, there appeared to be a consistent ratio of Men to Women. When changing the grouping from Gender to Discipline, it showed a growth specifically in swimming, with Synchronized Swimming being added in 1984 and Water Polo in 2000.
One amusing fact was that Golf was part of the Summer Olympic Games, though only 1900 and 1904, and the only countries to earn medals were United States, United Kingdom, and Canada. One depressing fact I uncovered was baseball only existed for 5 Olympic Games, from 1992 through 2008, when it ceased to be included.
Lastly, a strange discovery was a sport referred to as Jeu de Paume with its only occurrence during 1908. Conflicting information exists on this French, racquet-less, tennis-like sport, but the data table shows the United States earned Gold while the United Kingdom earned Silver and Bronze.
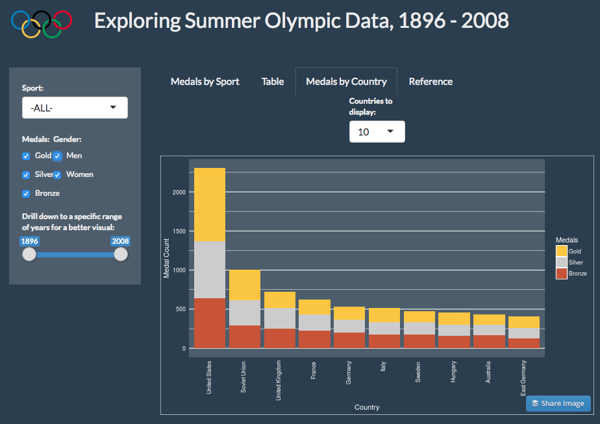
So which country has been the most successful (by medal count) in the history of the Summer Olympic Games? The United States with over 2,250 Olympic medals.
You can explore Brandon’s data in his app, Exploring Summer Olympic Data, 1896 - 2008.


